Leave a Message
Thank you for your message. I will be in touch with you shortly.
Explore Our Properties
Living room with a gray sofa, glass coffee table, abstract wall art, and a large window.
Market Report May 2023

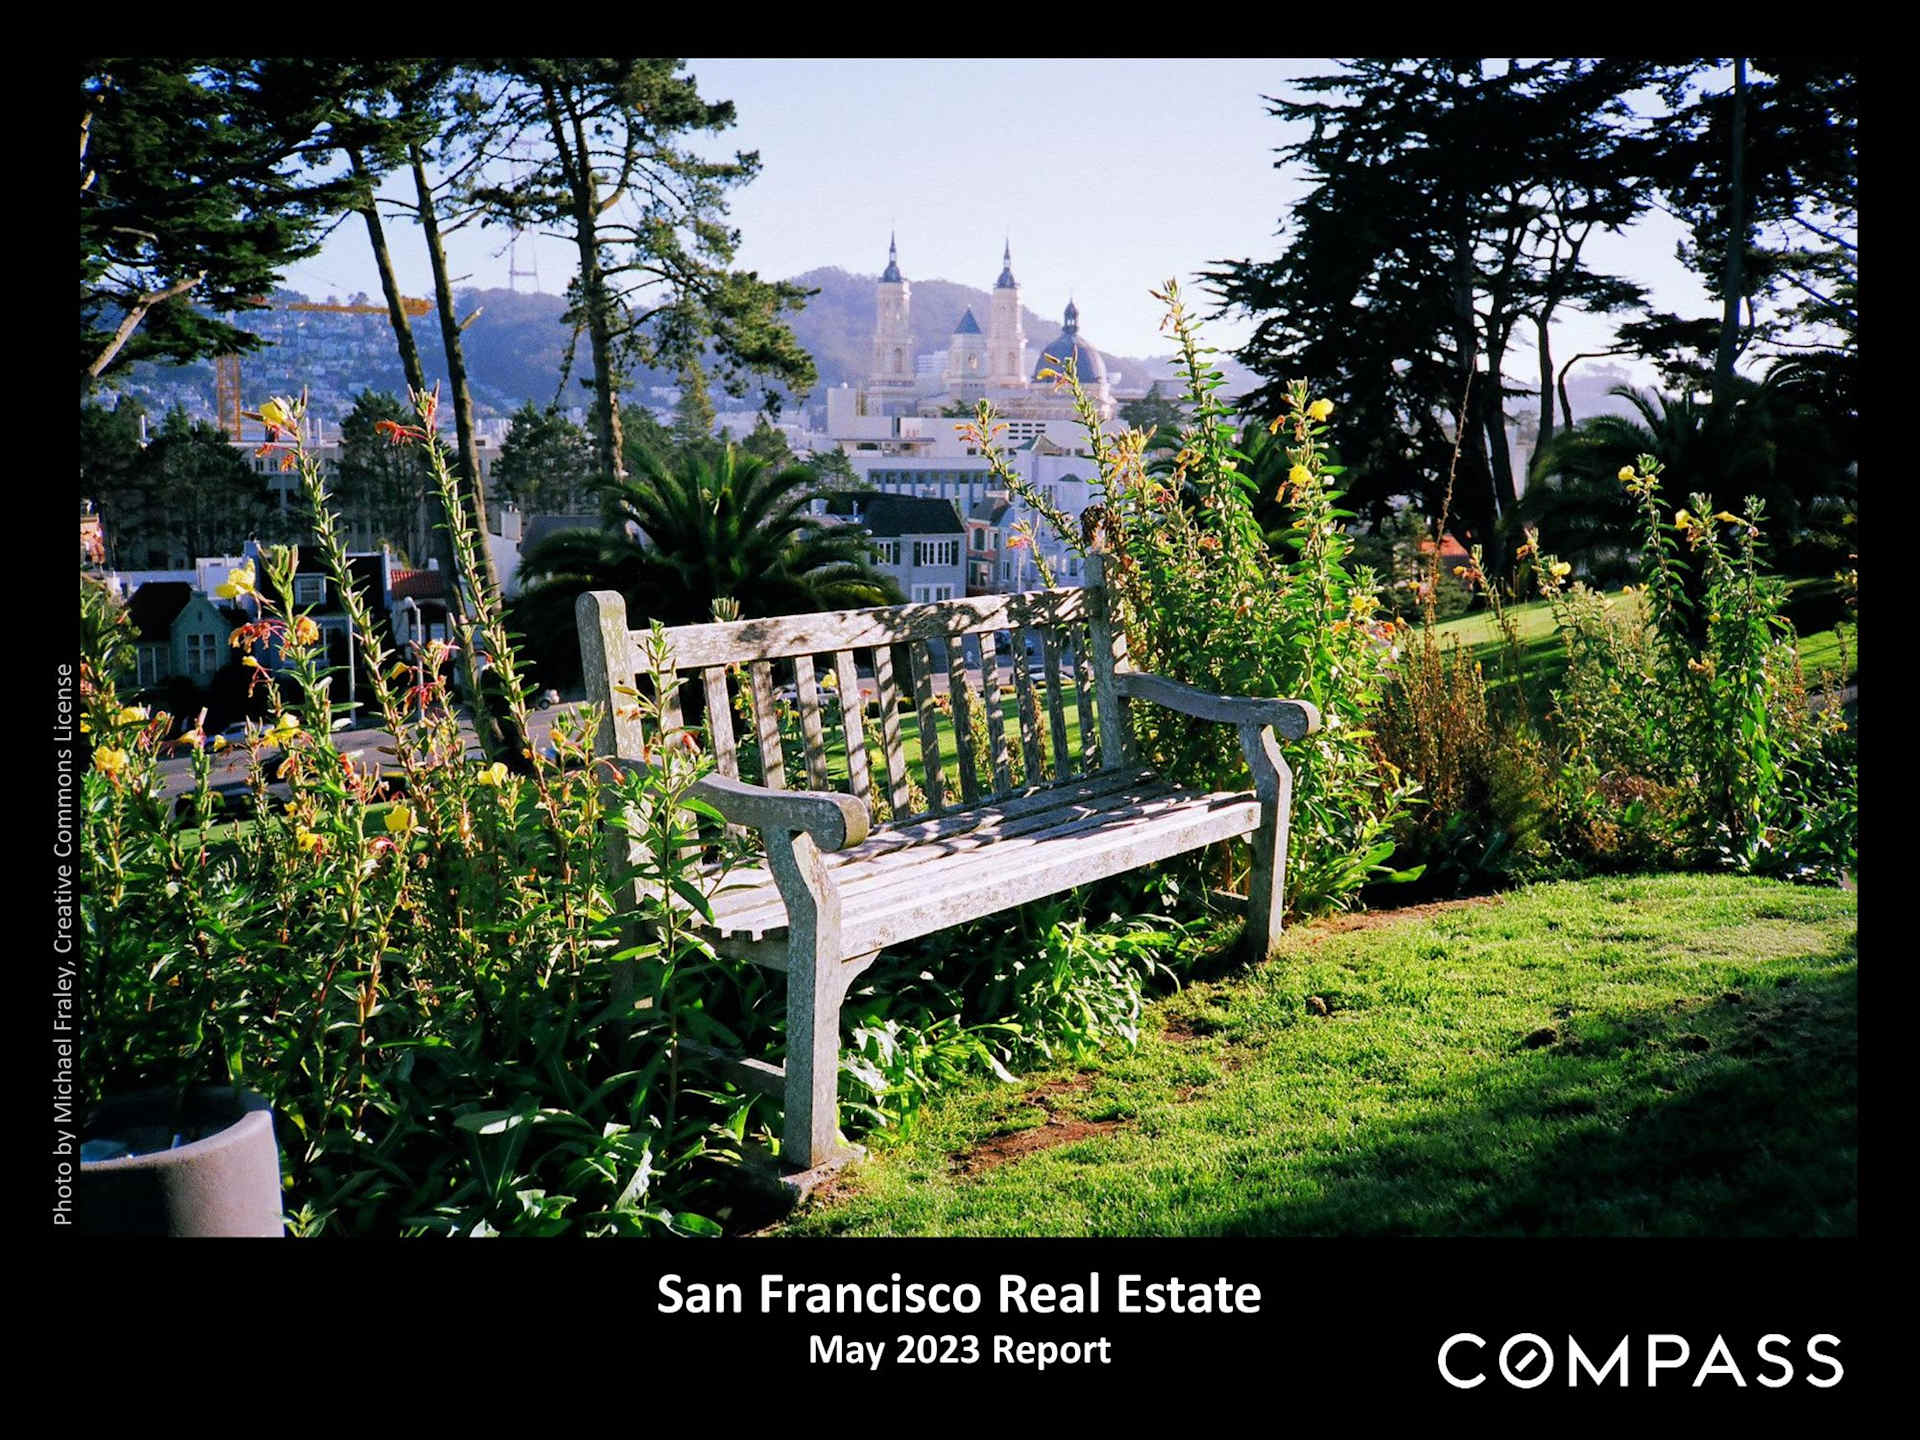
San Francisco real estate market report cover, featuring a garden bench overlooking city buildings.

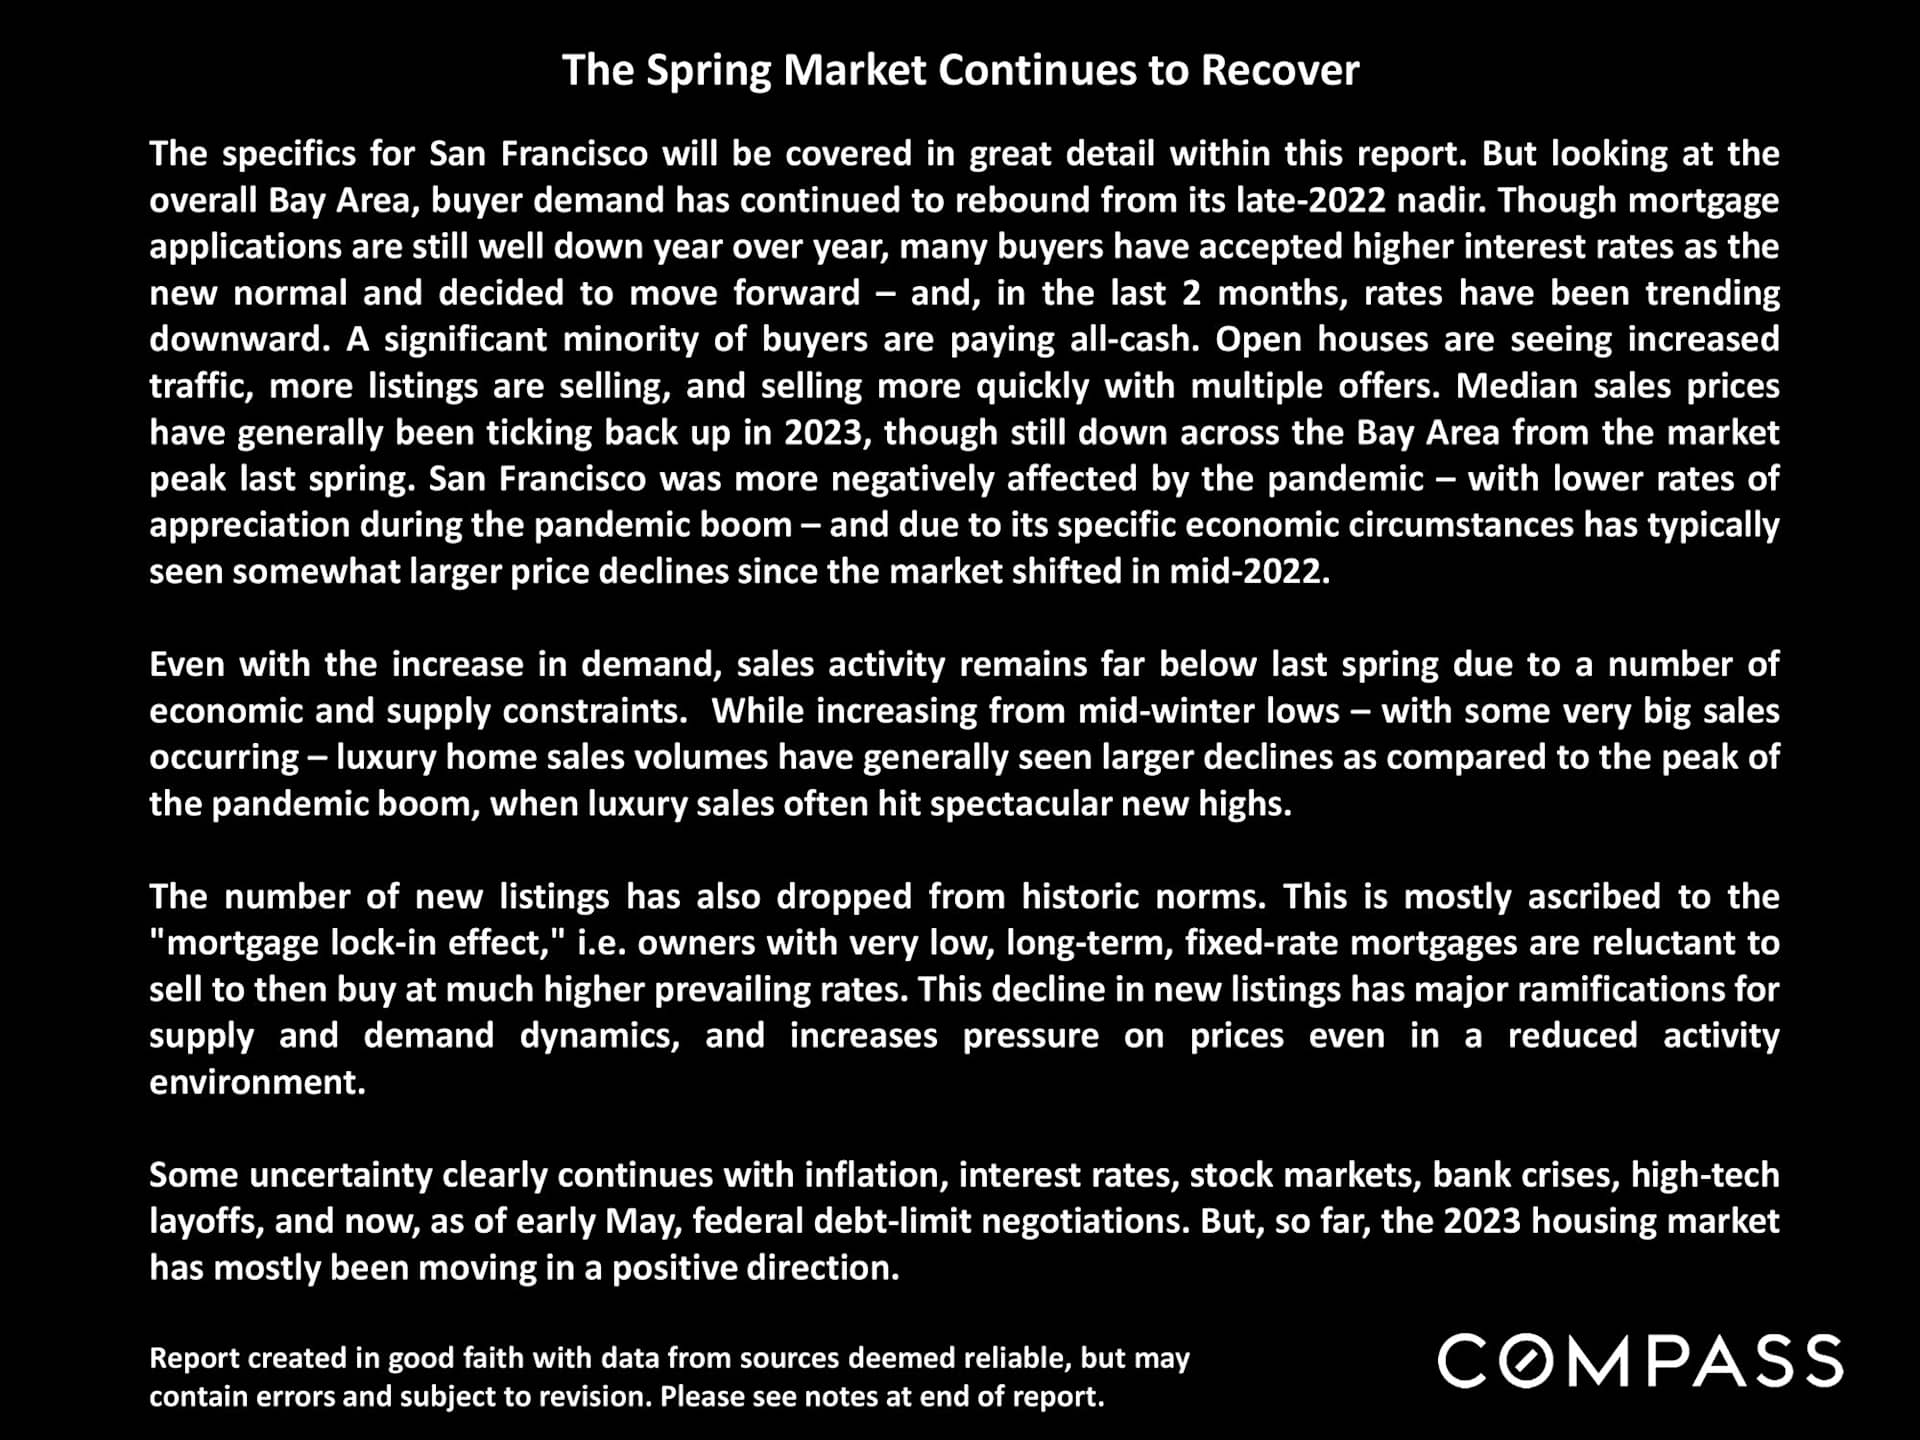
May 2023 market report describing the recovering Bay Area housing market, with a Compass logo.

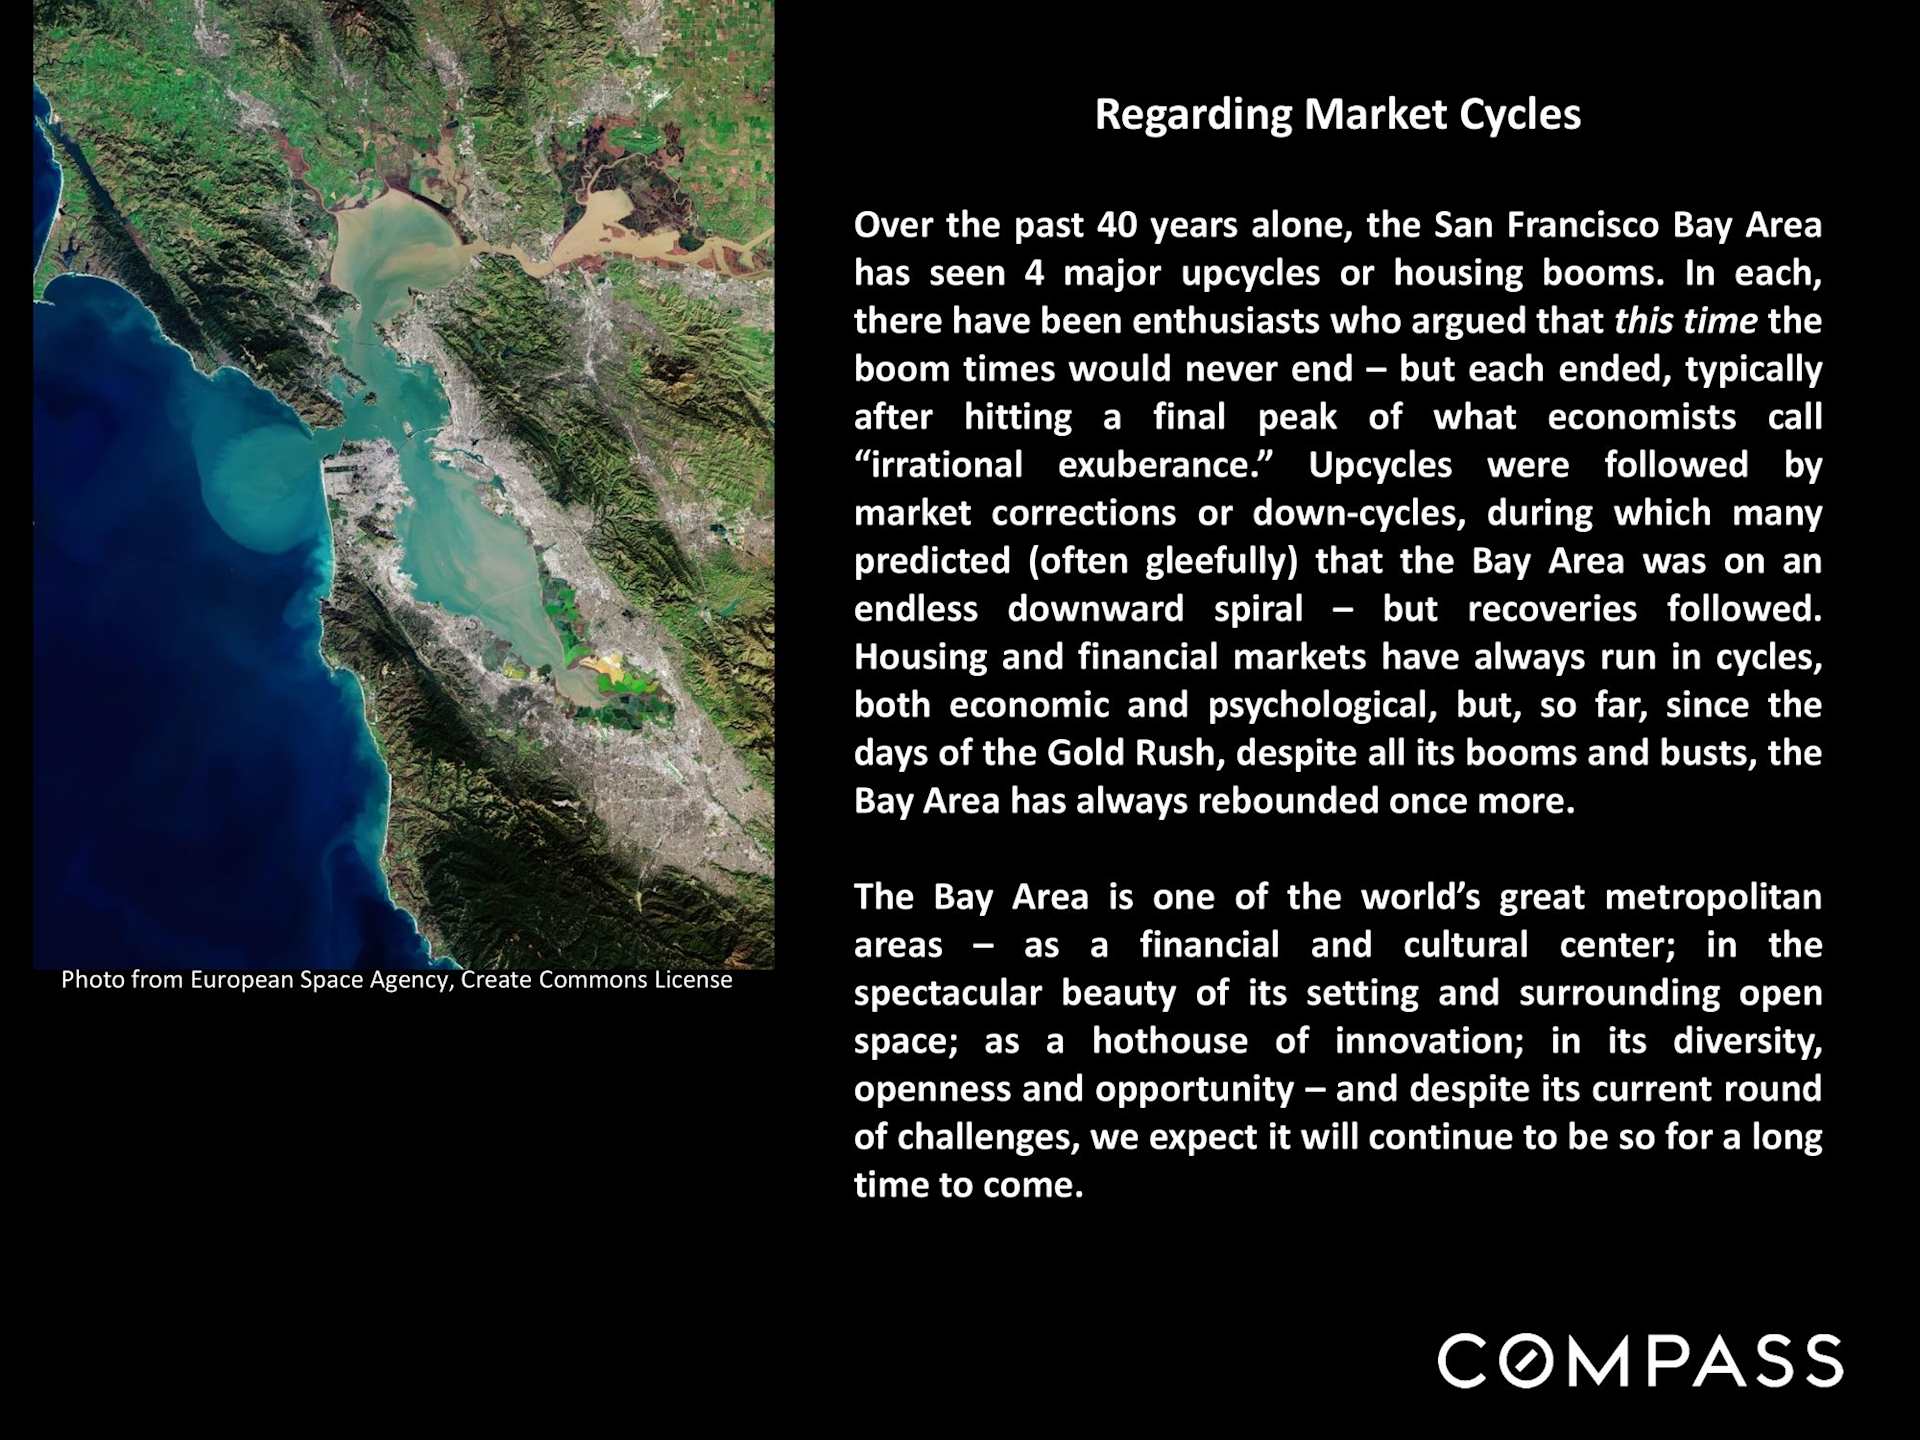
Market cycles graphic with a satellite view of the San Francisco Bay Area and explanatory text.

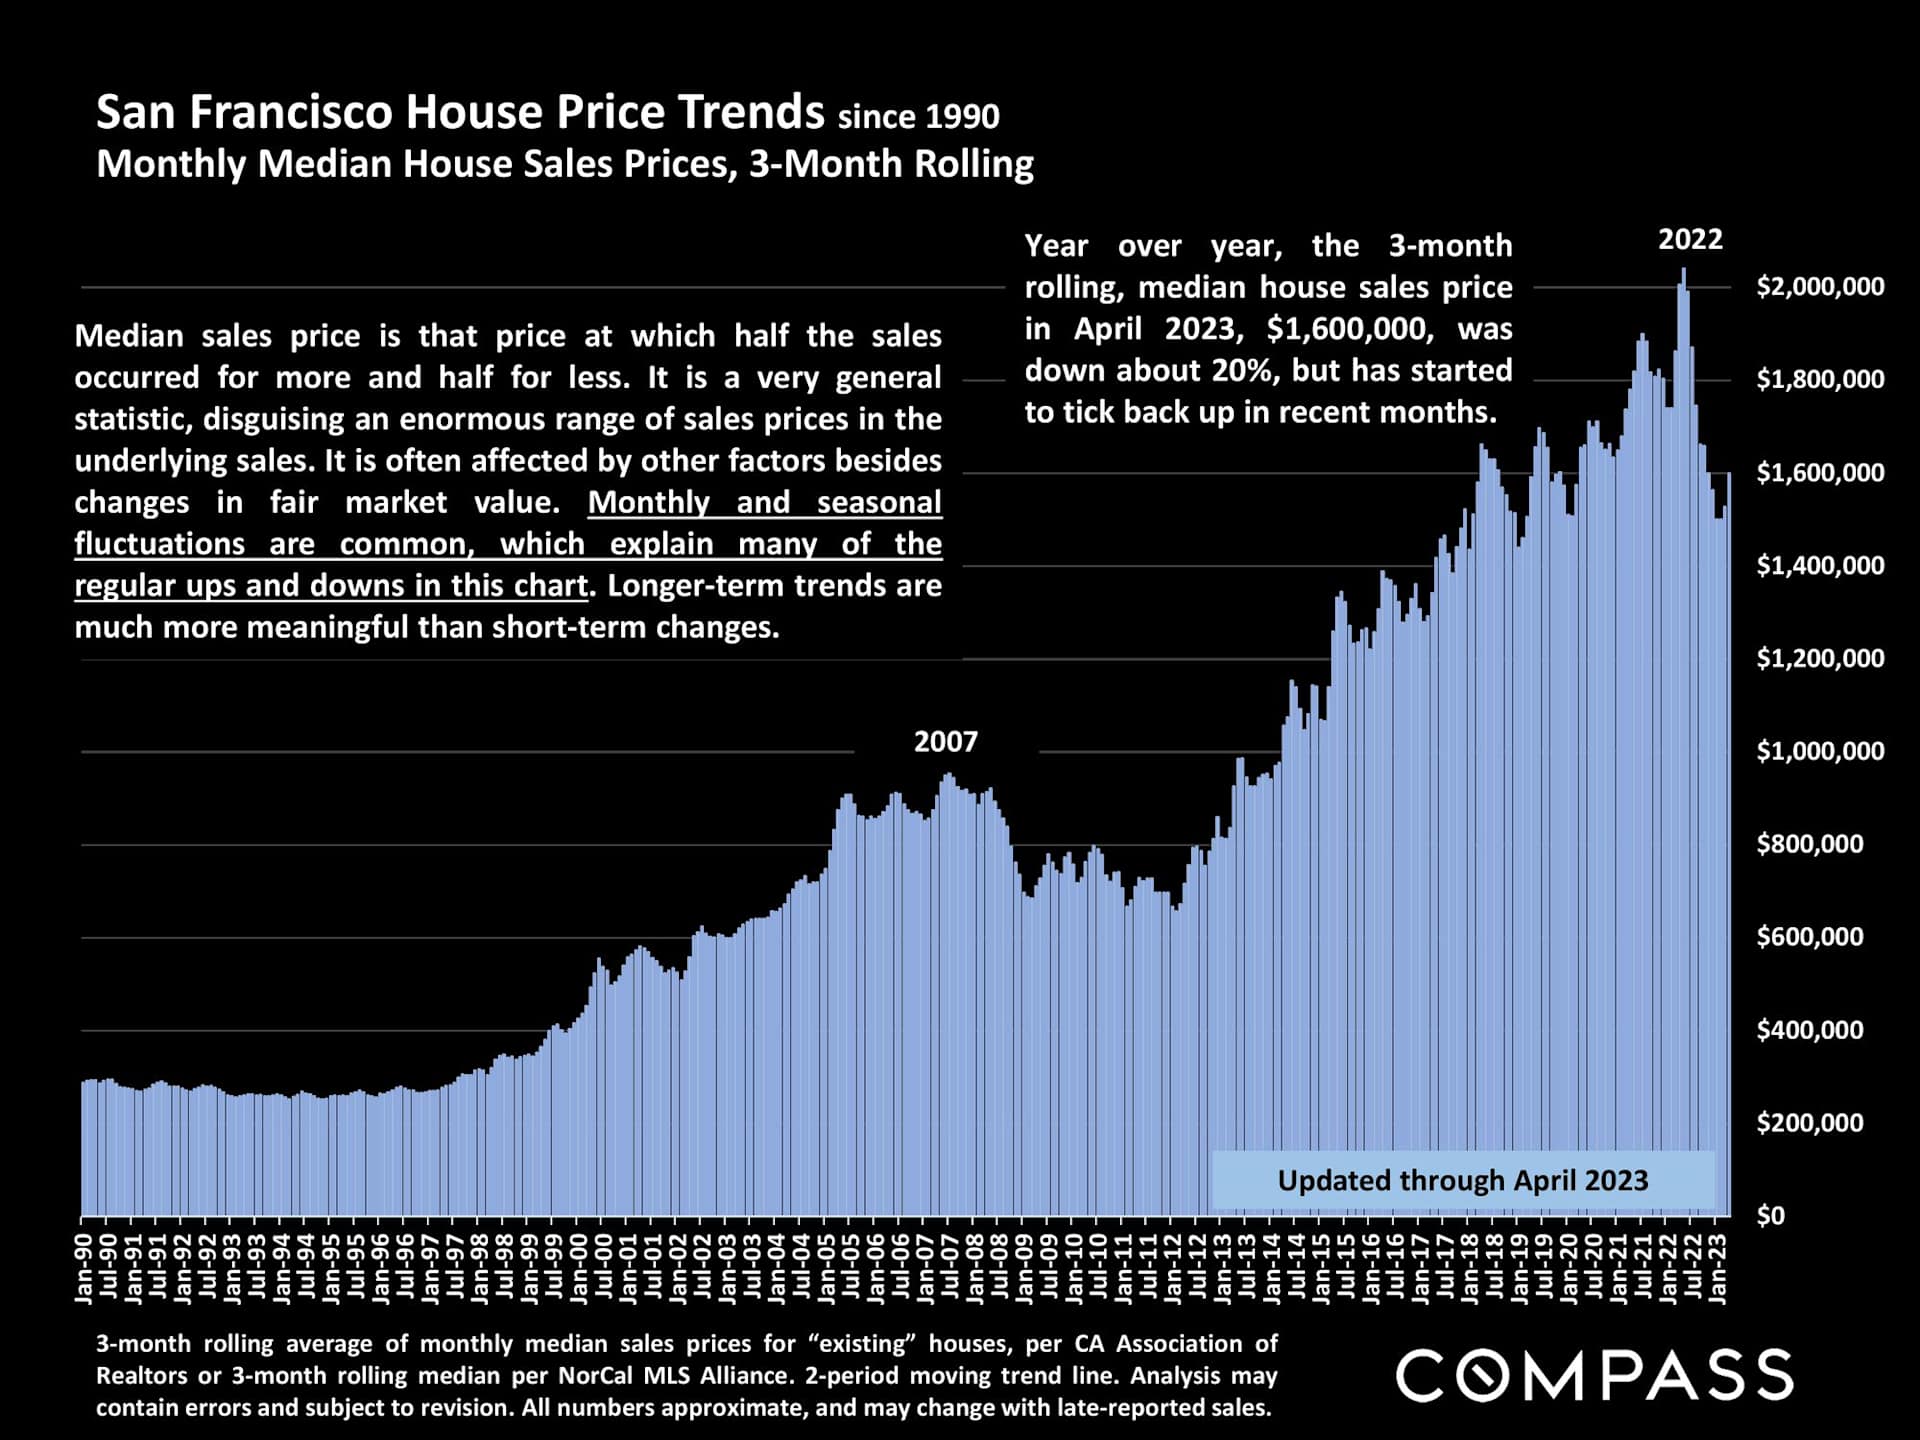
Chart of San Francisco median house prices from 1990 to April 2023, peaking near $2 million in 2022.

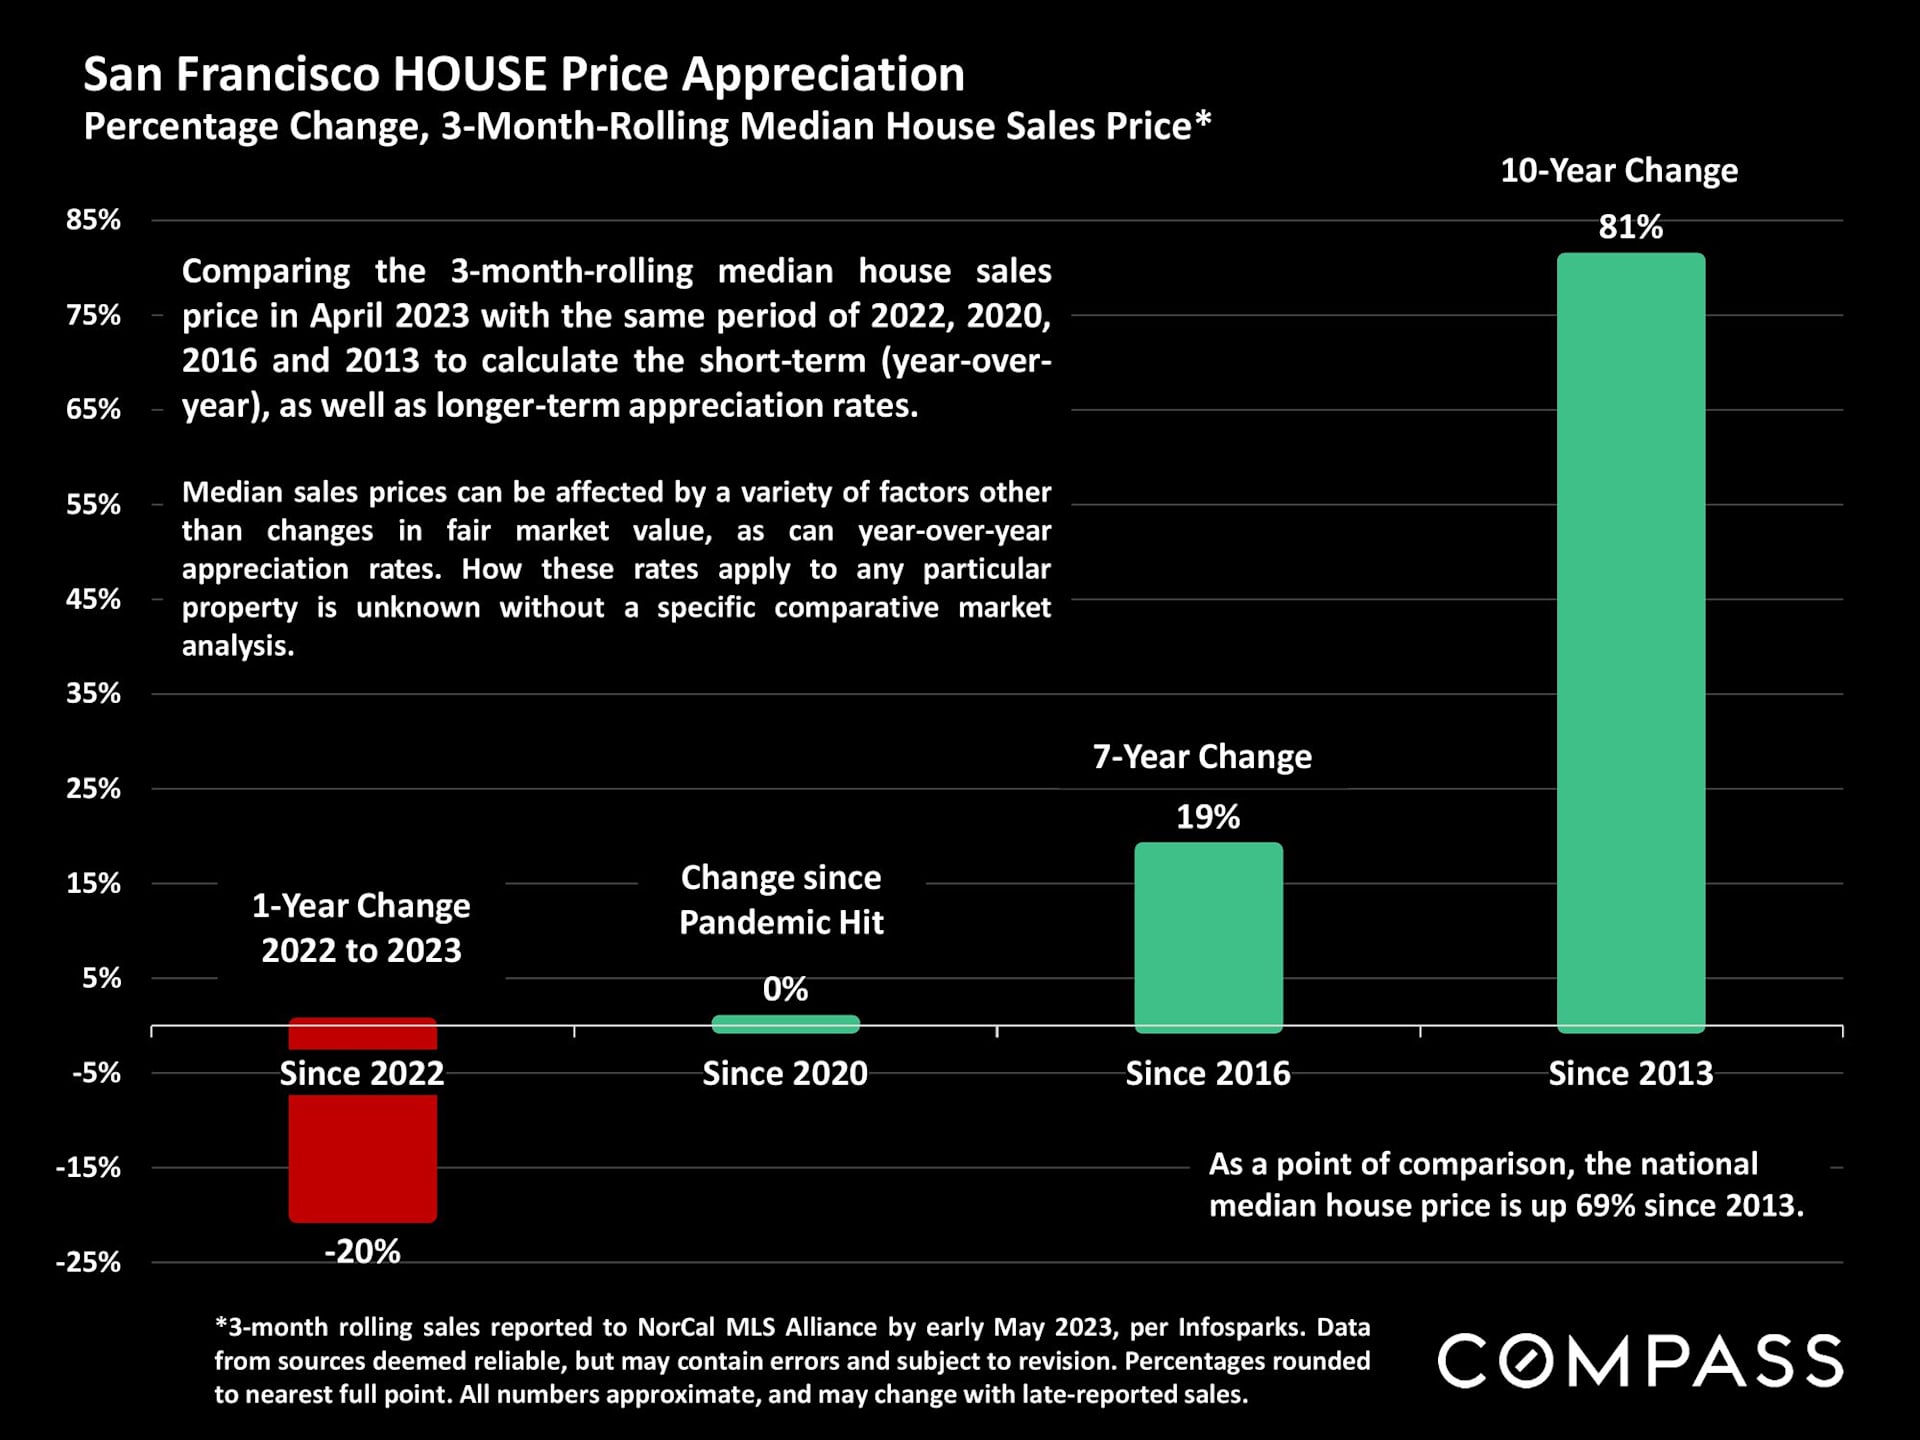
San Francisco house-price appreciation chart: down 20% since 2022, flat since 2020, up 19% since 2016 and 81% since 2013.

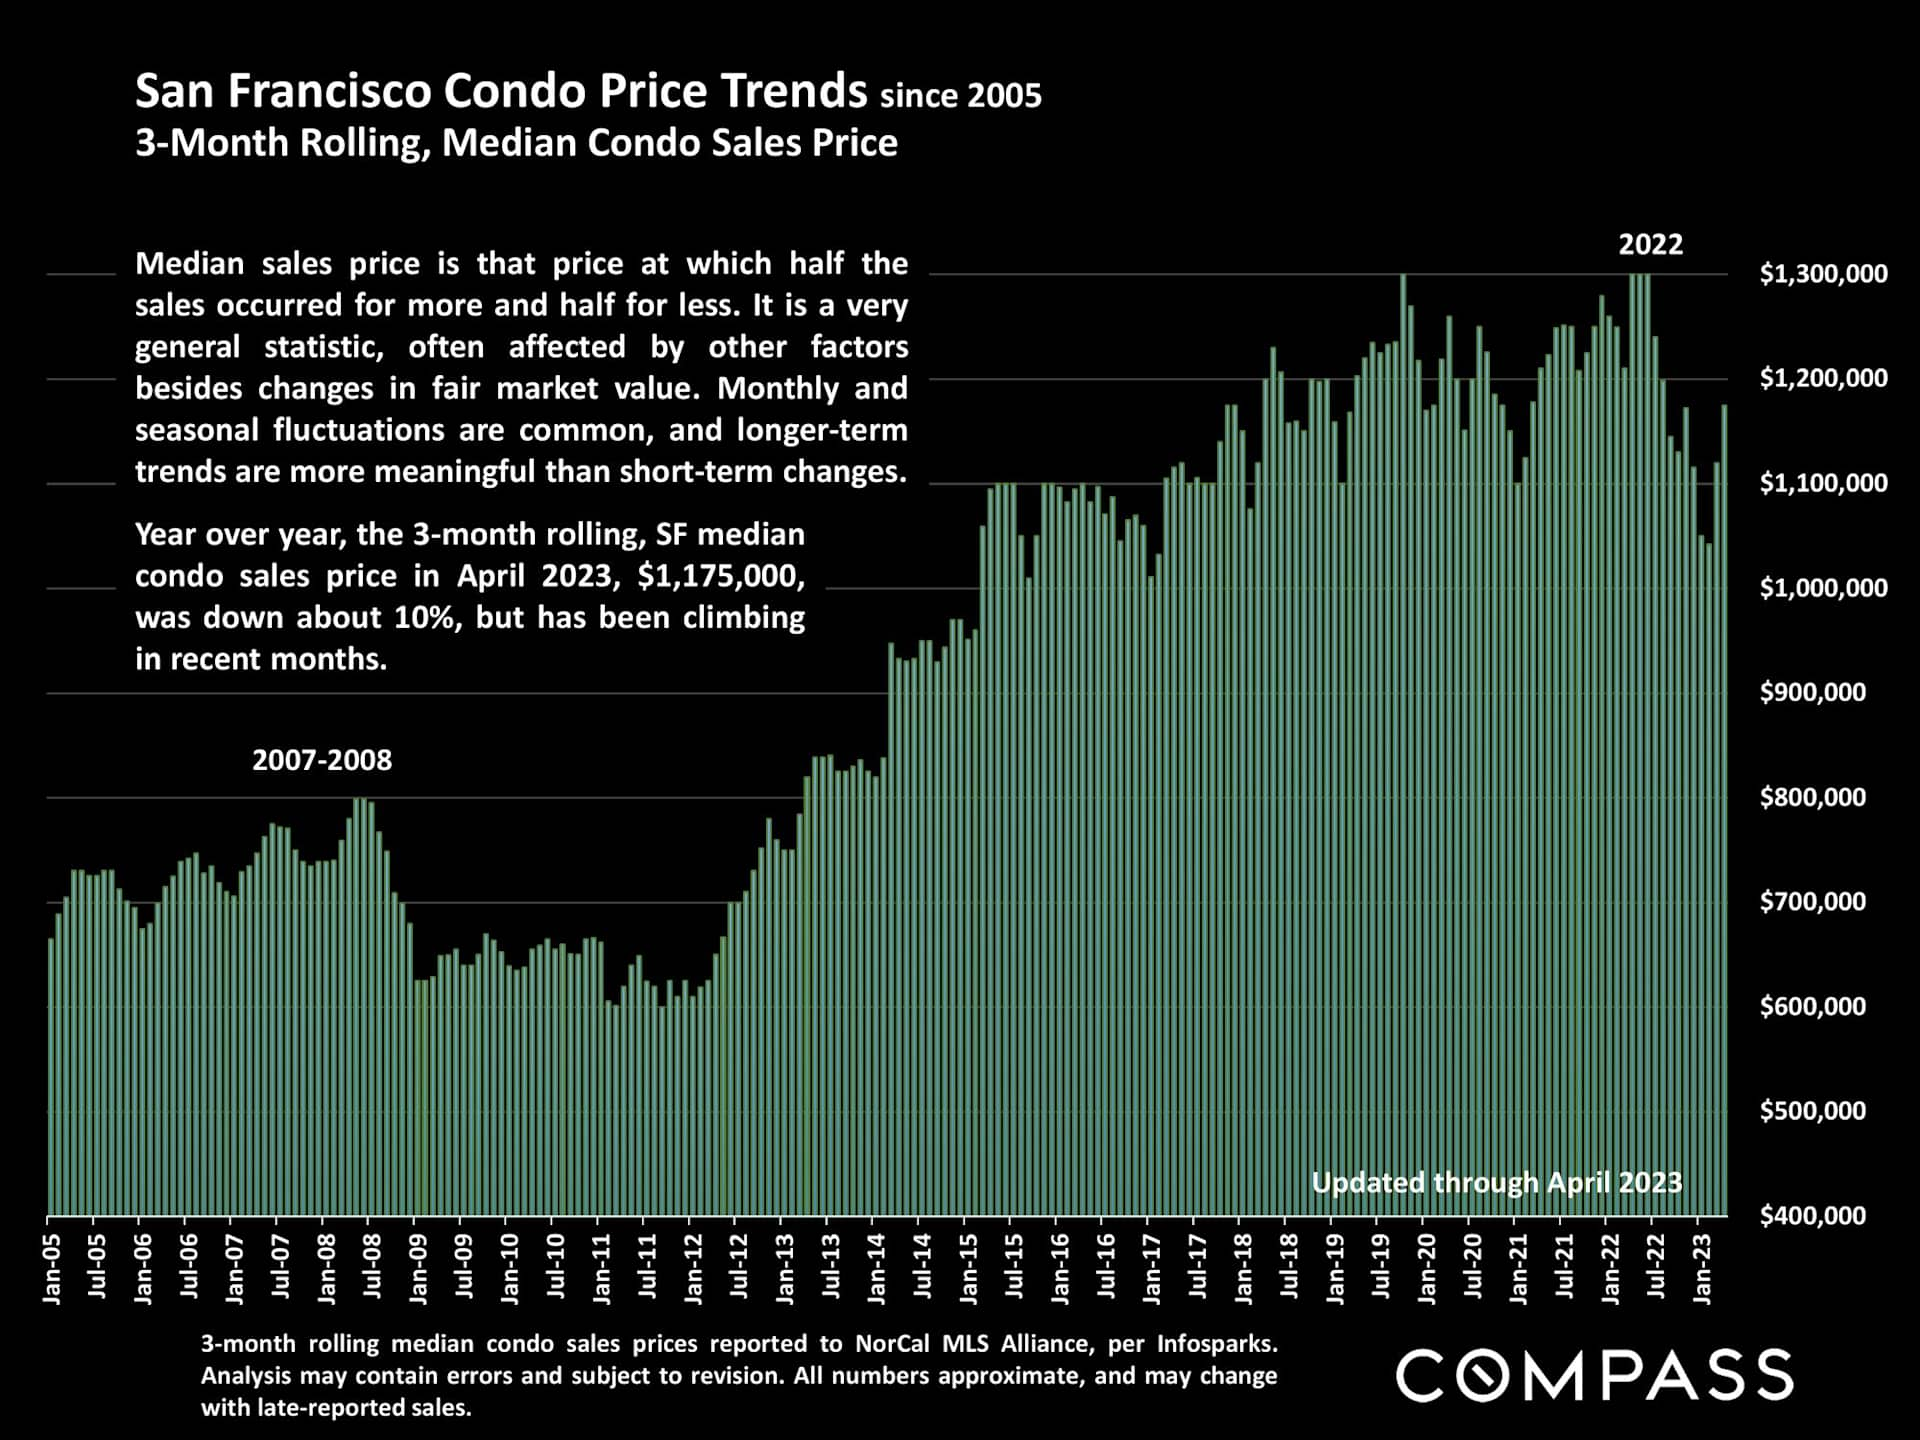
Chart of San Francisco condo median prices from 2005 to April 2023, with a 2022 peak near $1.3 million.

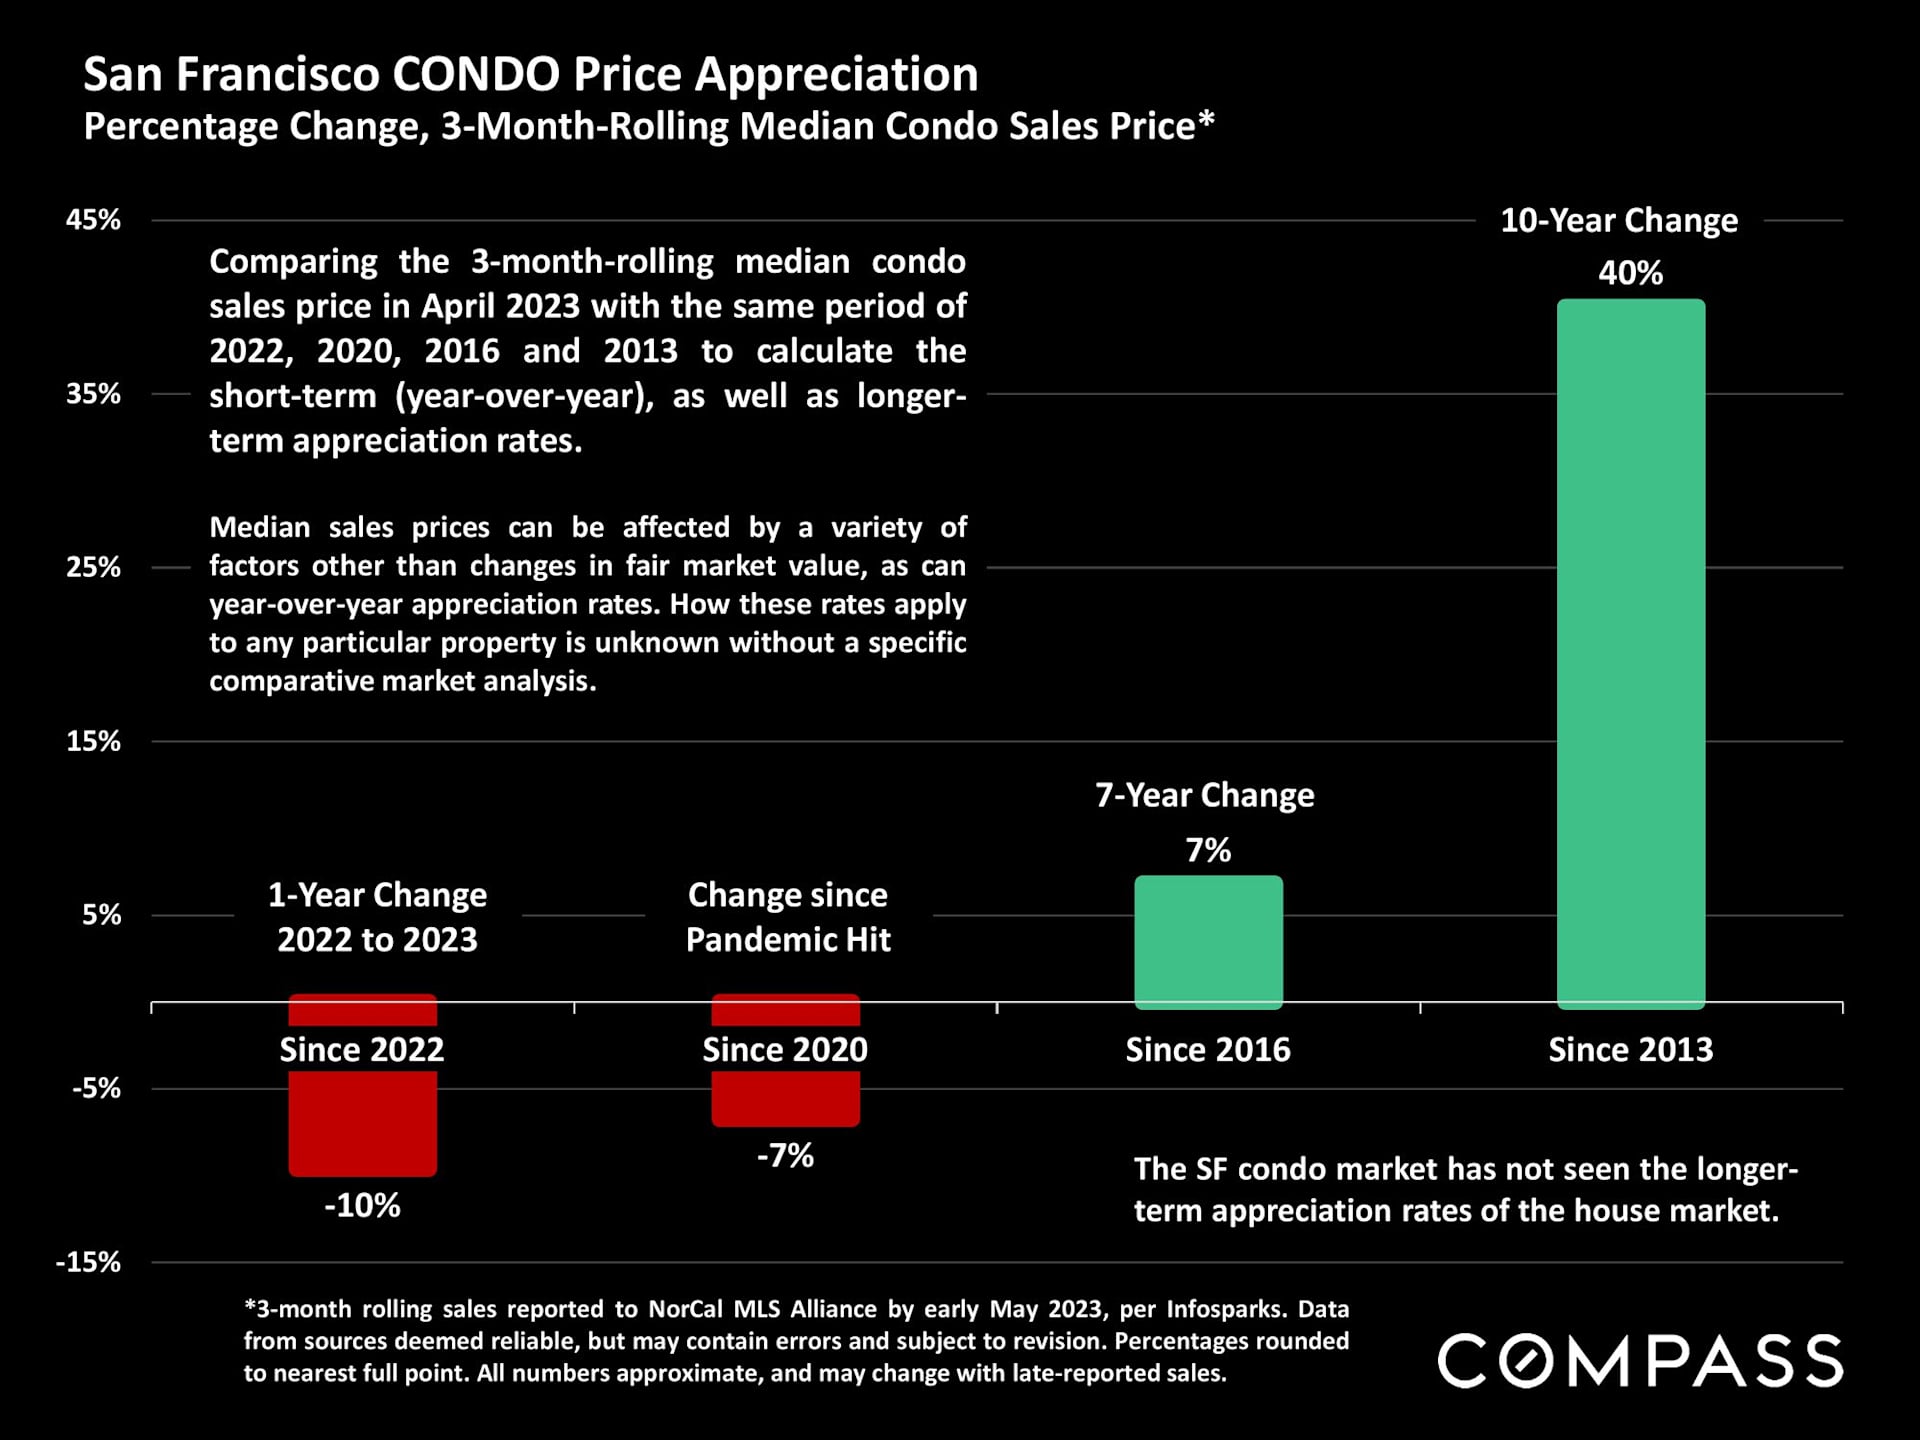
San Francisco condo price appreciation chart, showing declines since 2022 and 2020 and gains since 2016 and 2013.

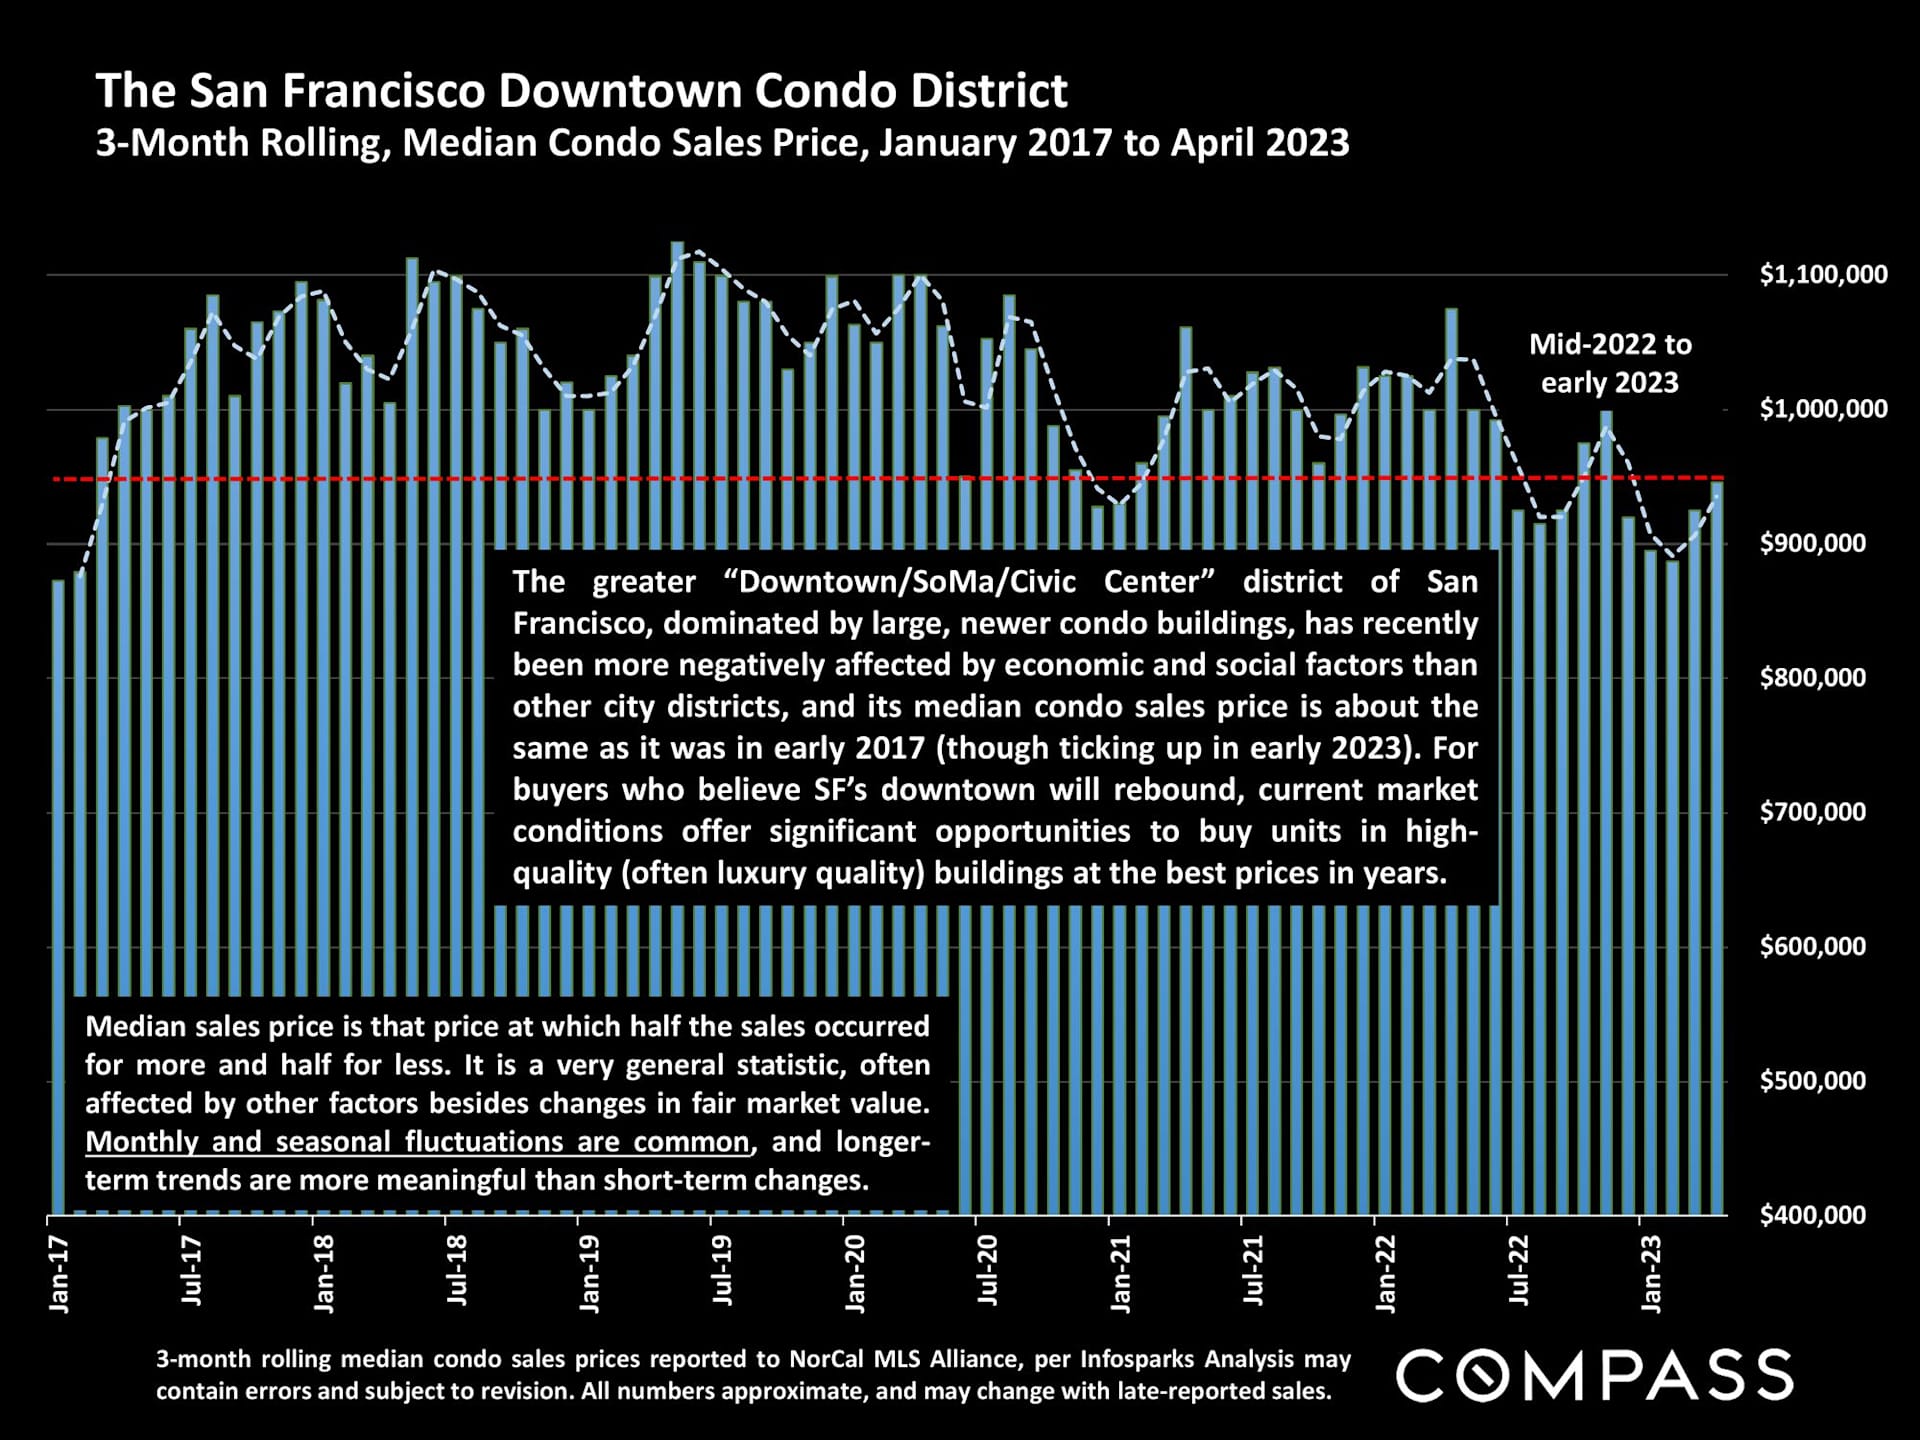
Chart of San Francisco downtown condo prices, showing a decline in 2022 and a slight rise in early 2023.

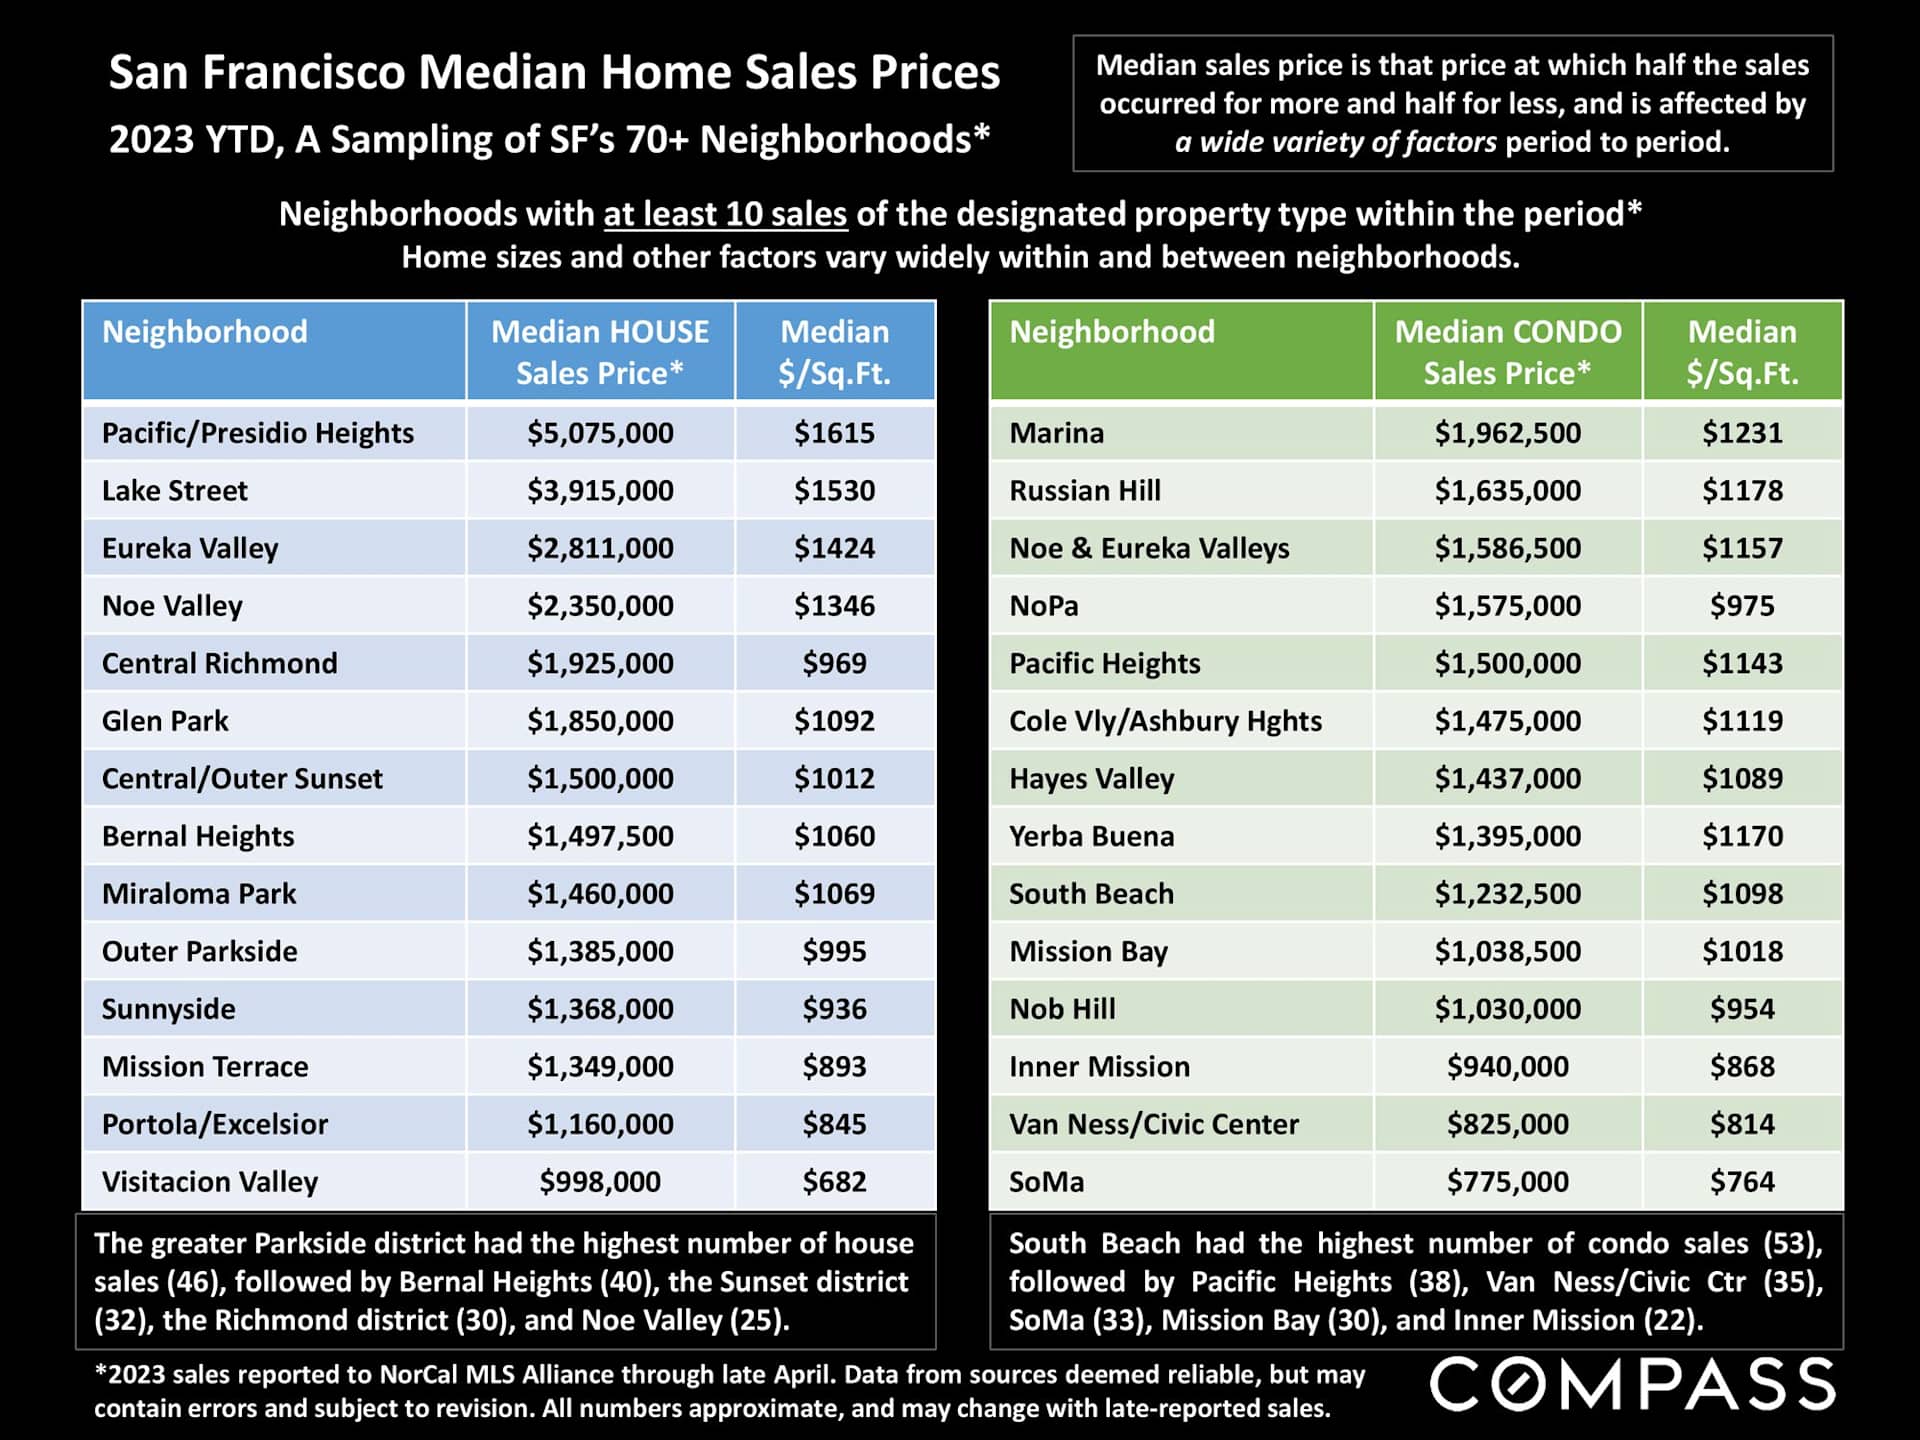
San Francisco 2023 year-to-date median house and condo prices by neighborhood, with prices per square foot.

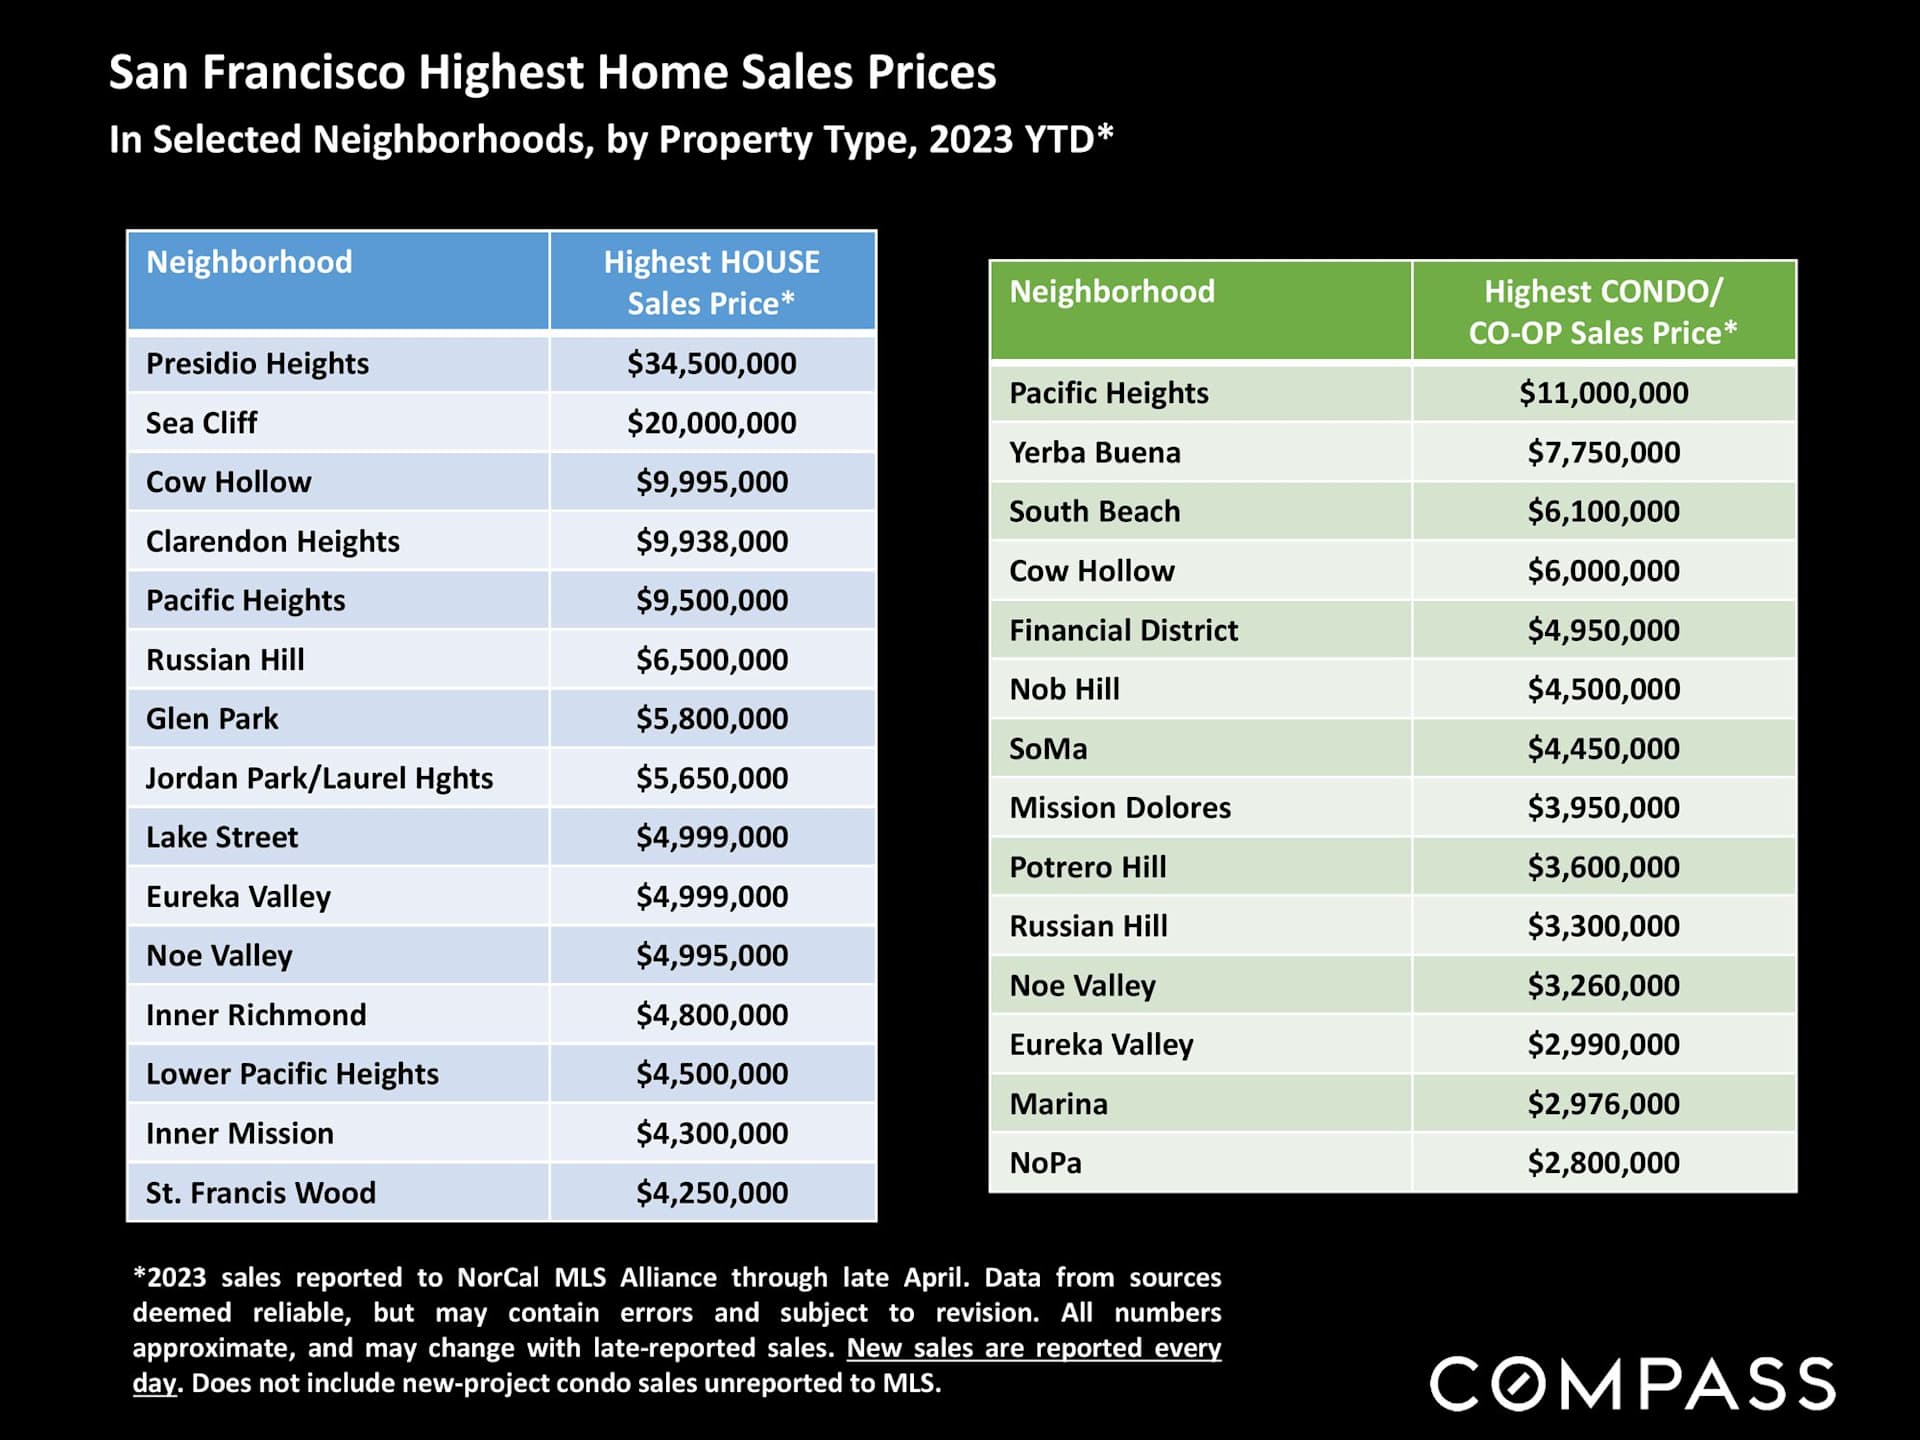
San Francisco 2023 year-to-date highest home and condo sales prices by neighborhood.

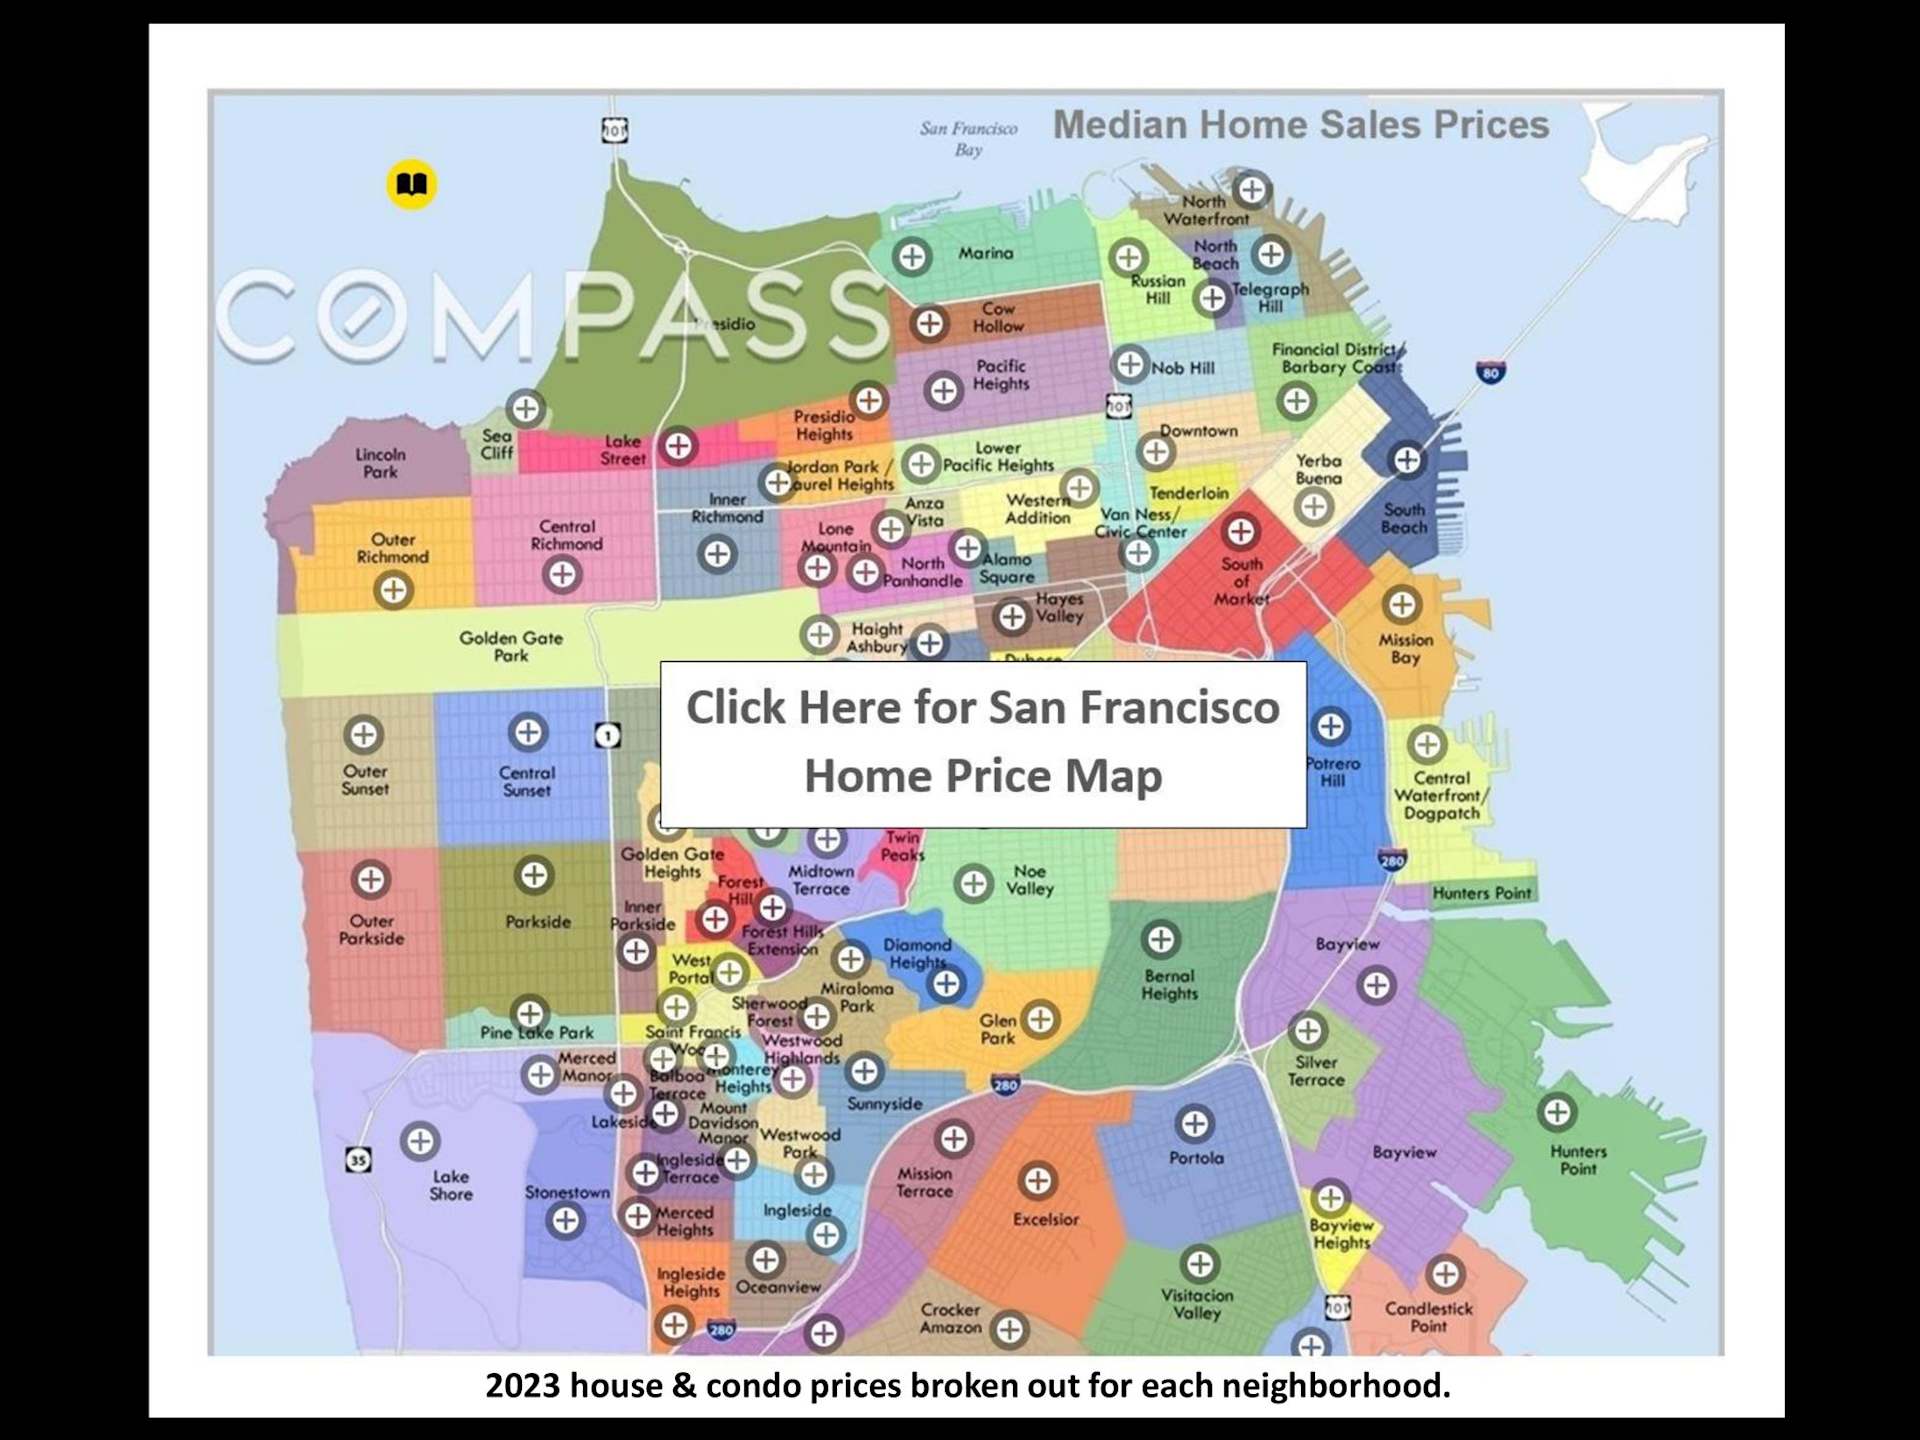
Map of San Francisco neighborhoods showing median home sales prices, with a link to the home price map.

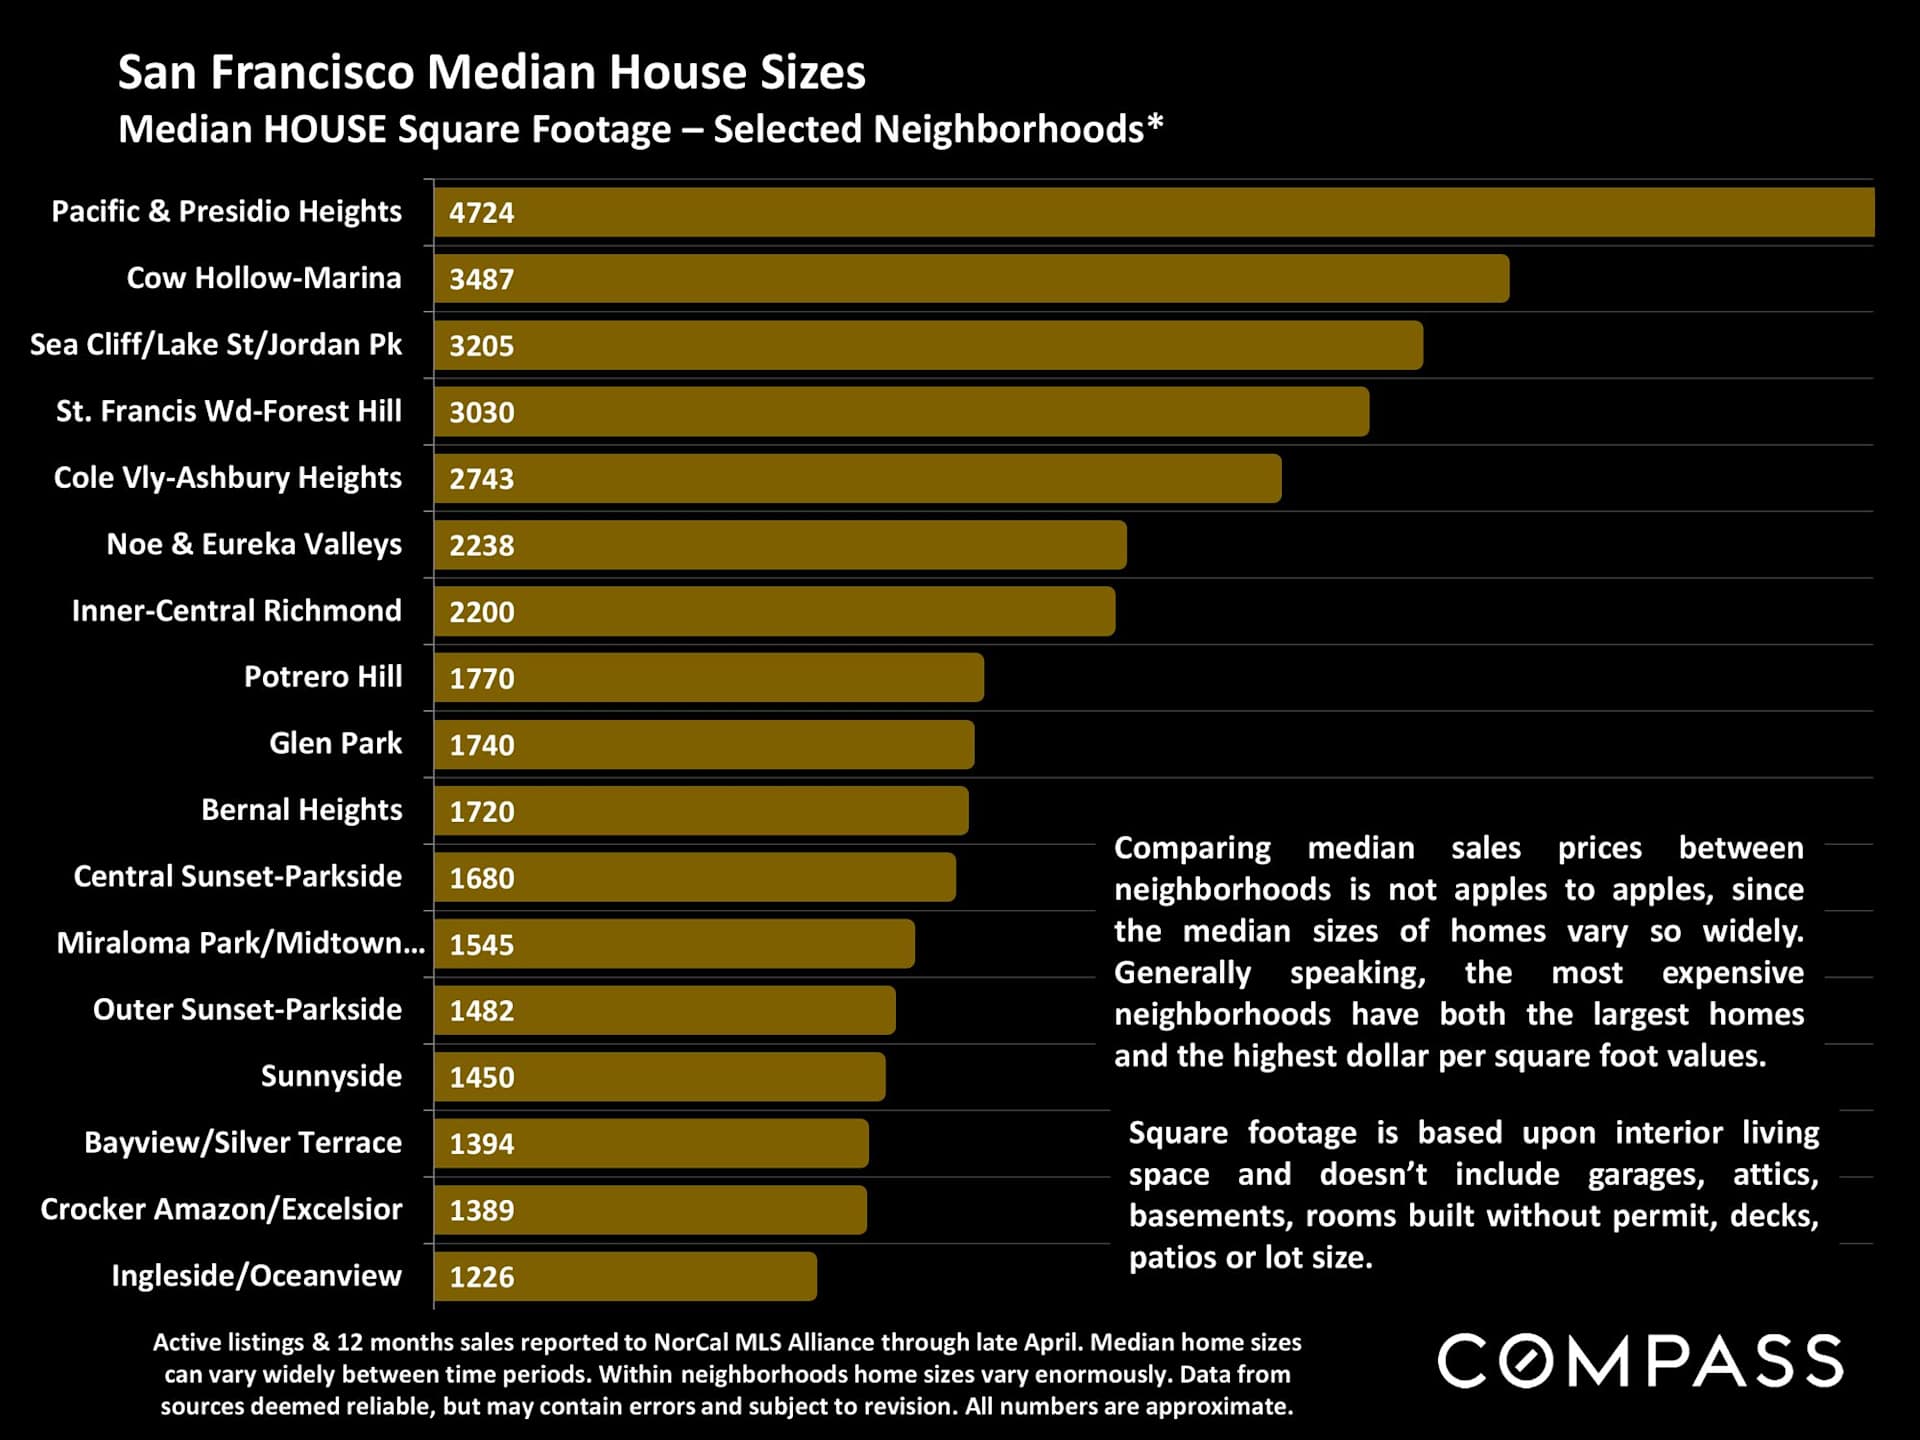
Chart compares median house sizes across 18 San Francisco neighborhoods, from Pacific Heights at 4,724 to Ingleside at 1,226 square feet.

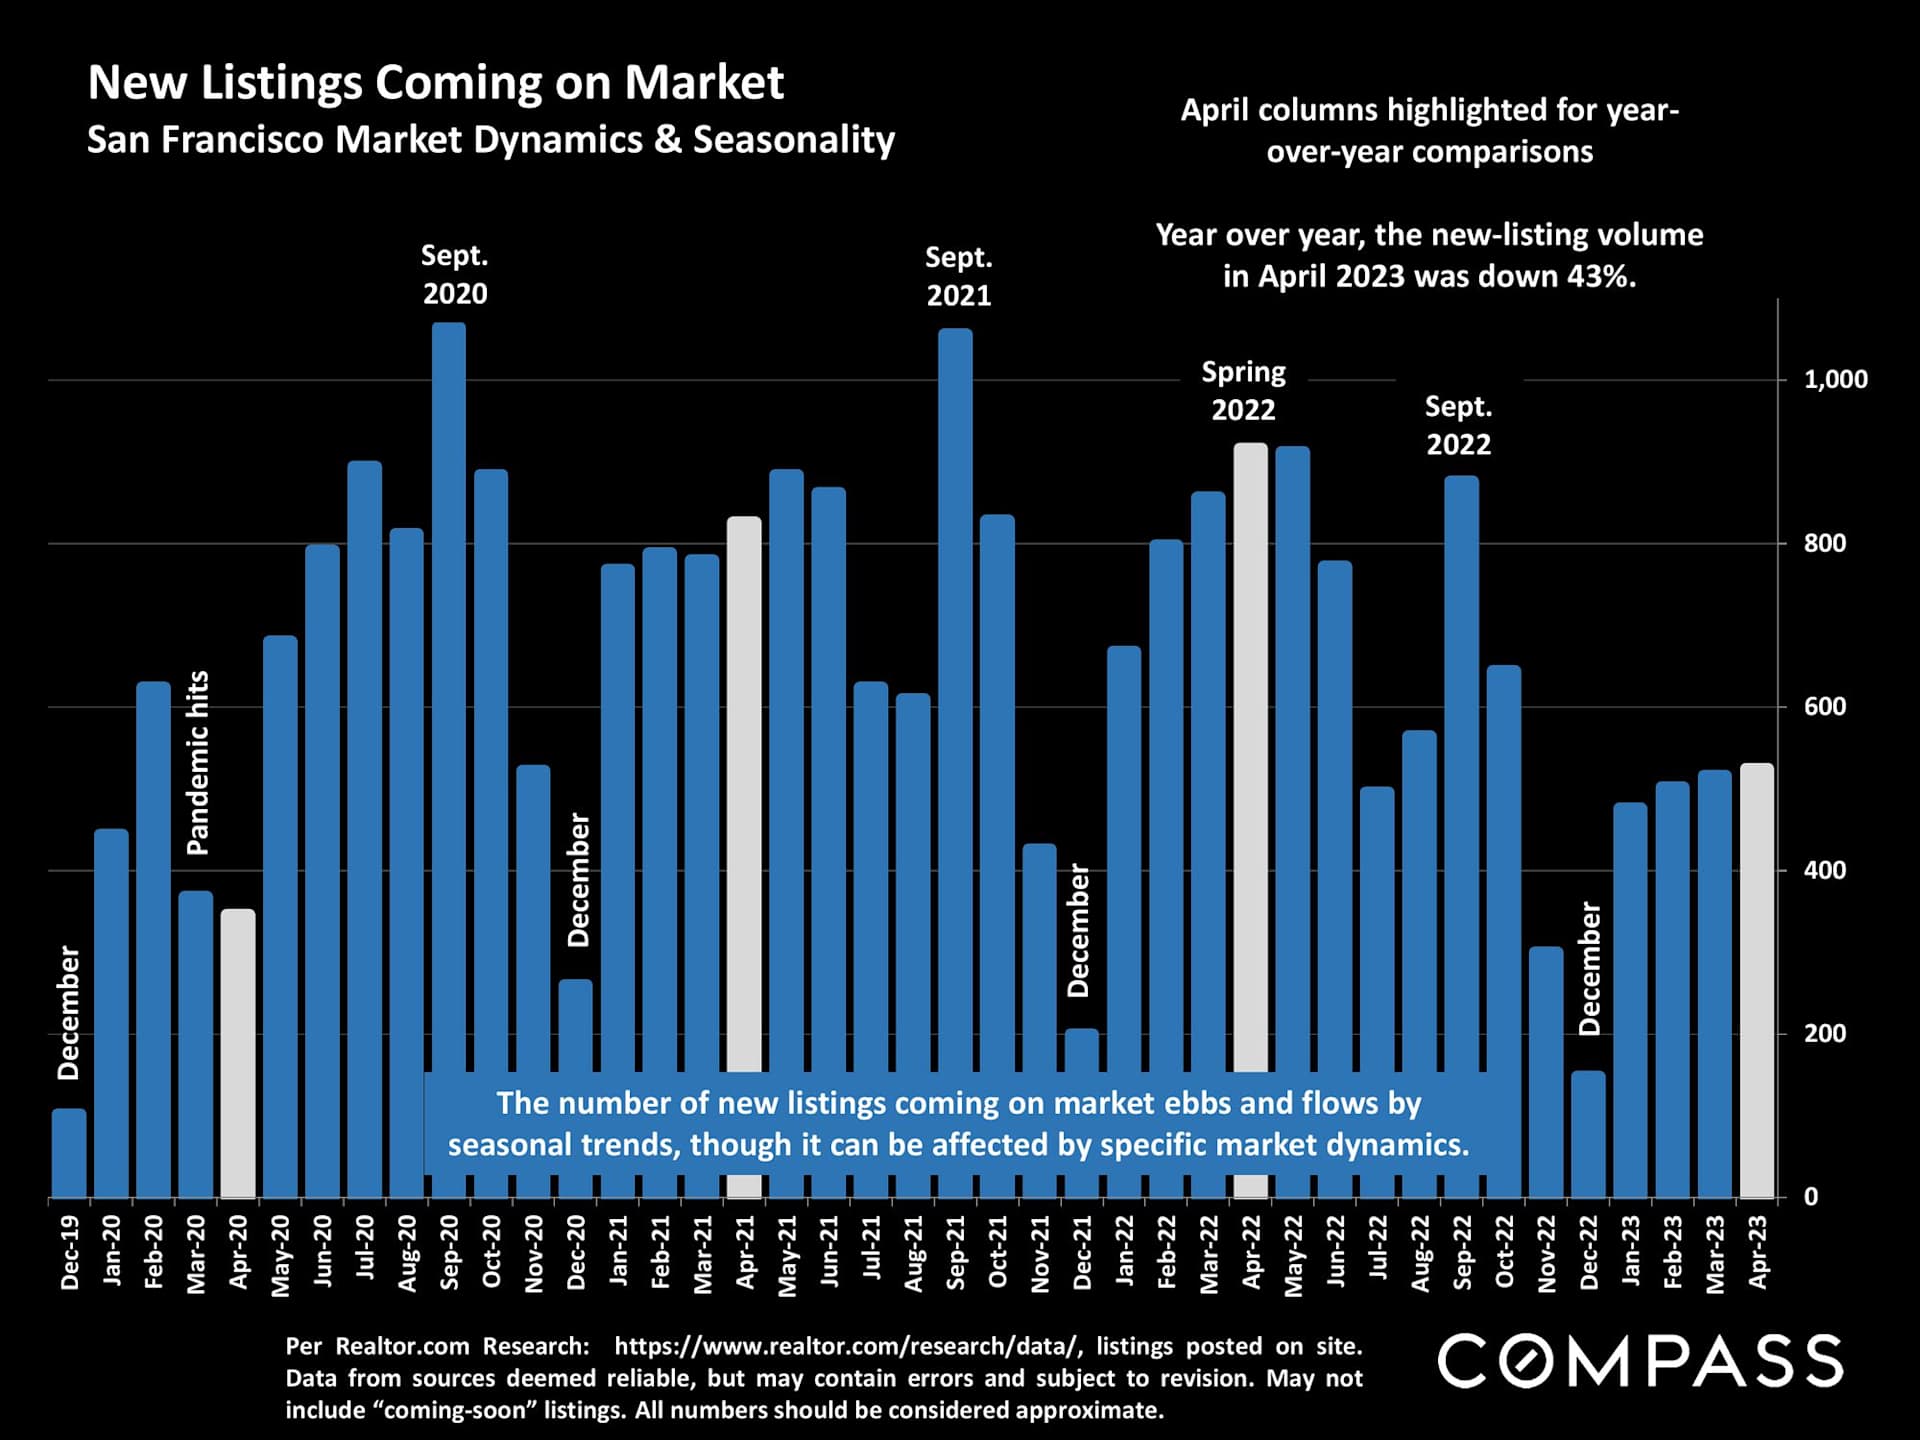
Bar chart of monthly San Francisco new listings, December 2019–April 2023; April 2023 volume was down 43% year over year.

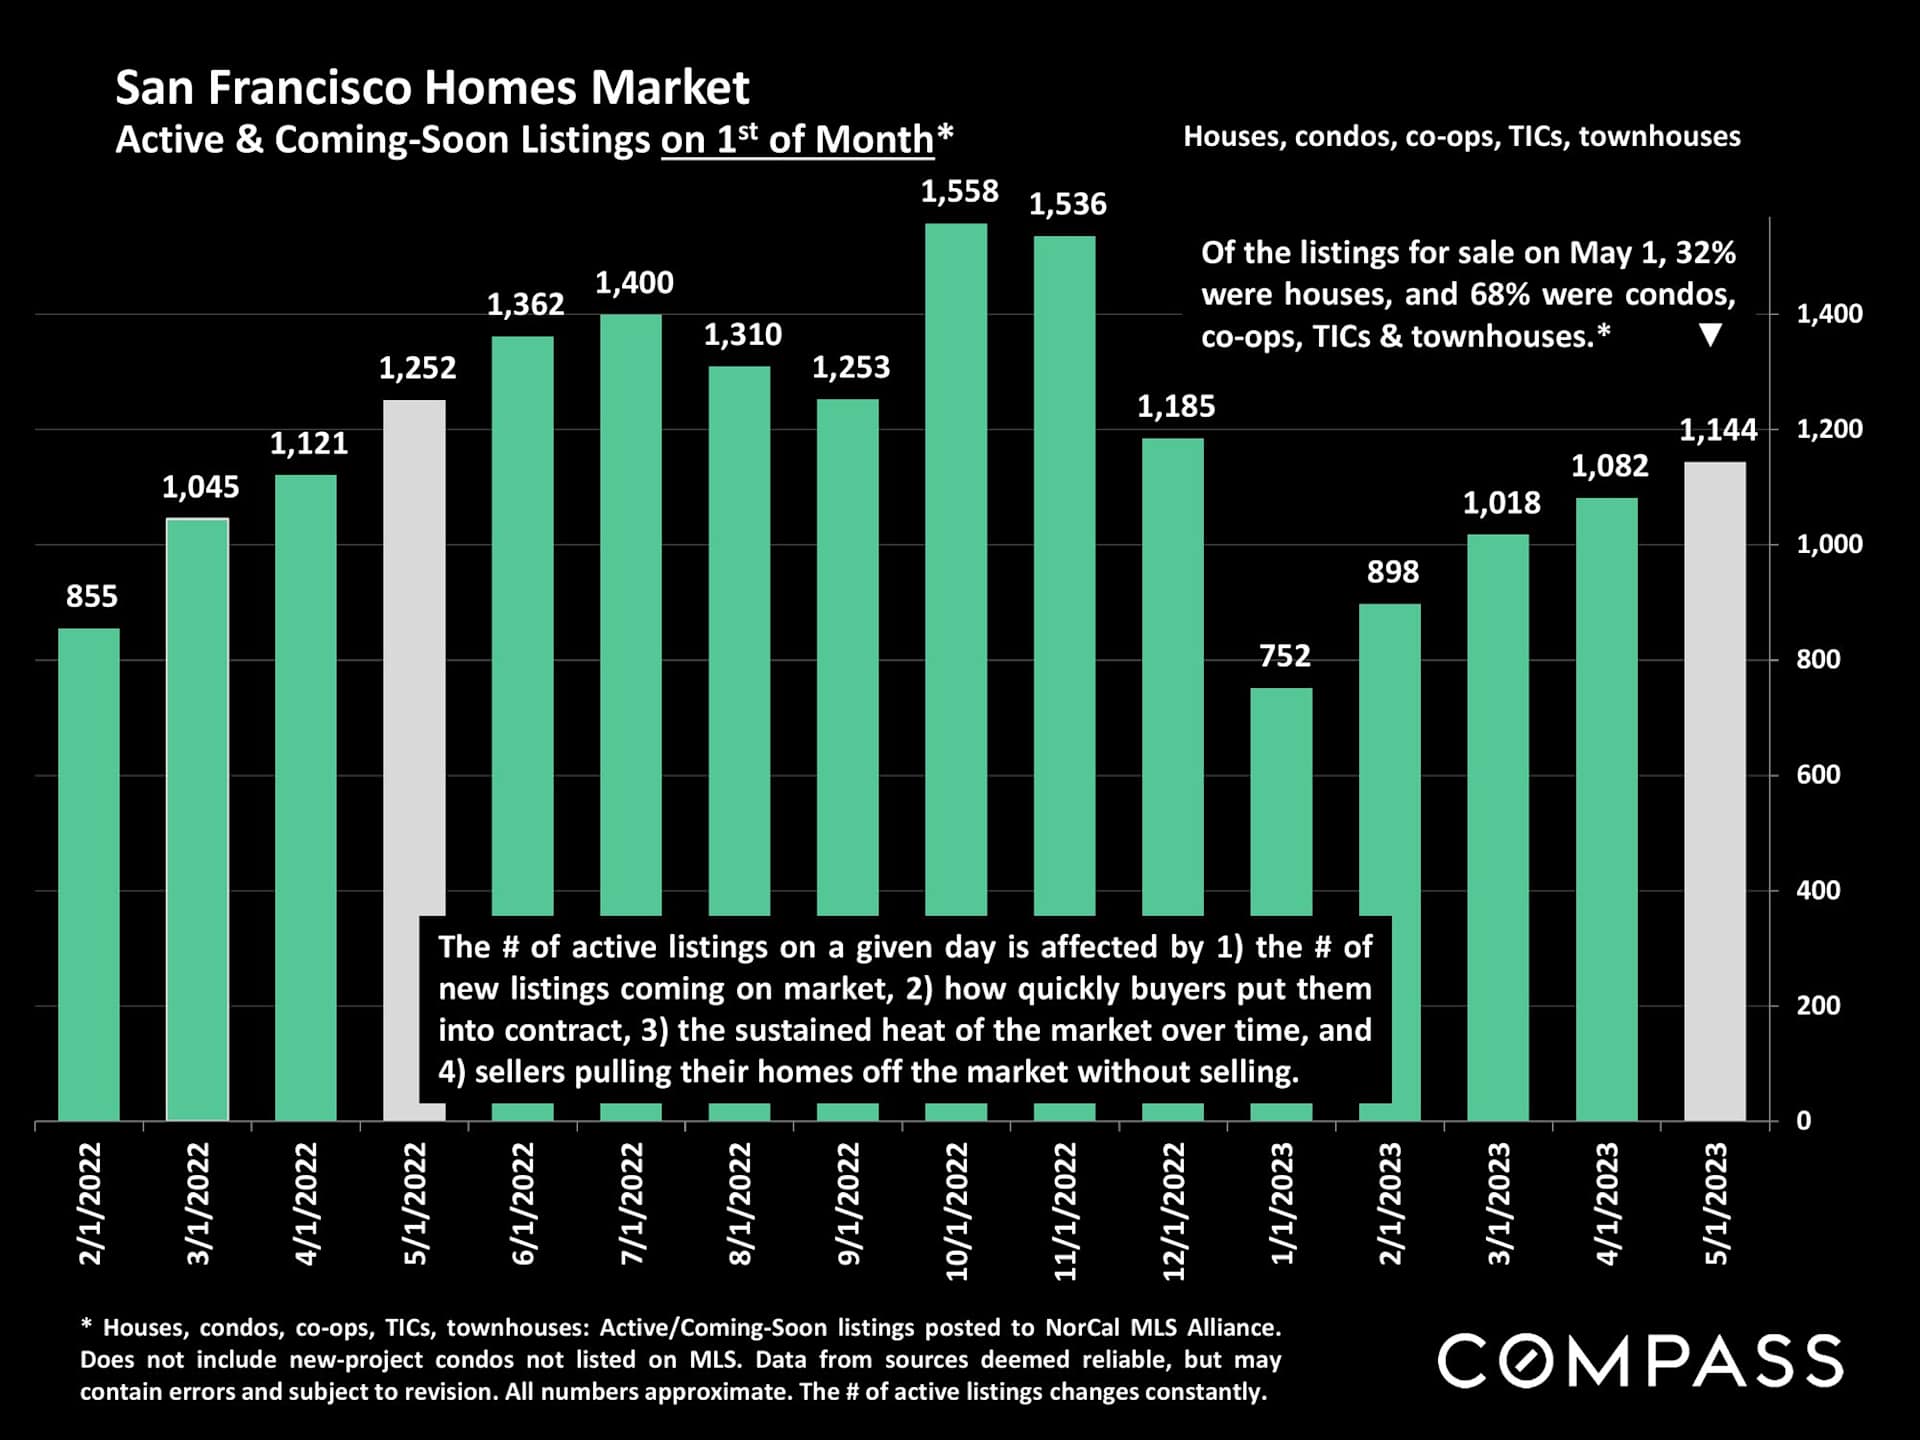
Bar chart of San Francisco active and coming-soon home listings, February 2022 to May 2023.

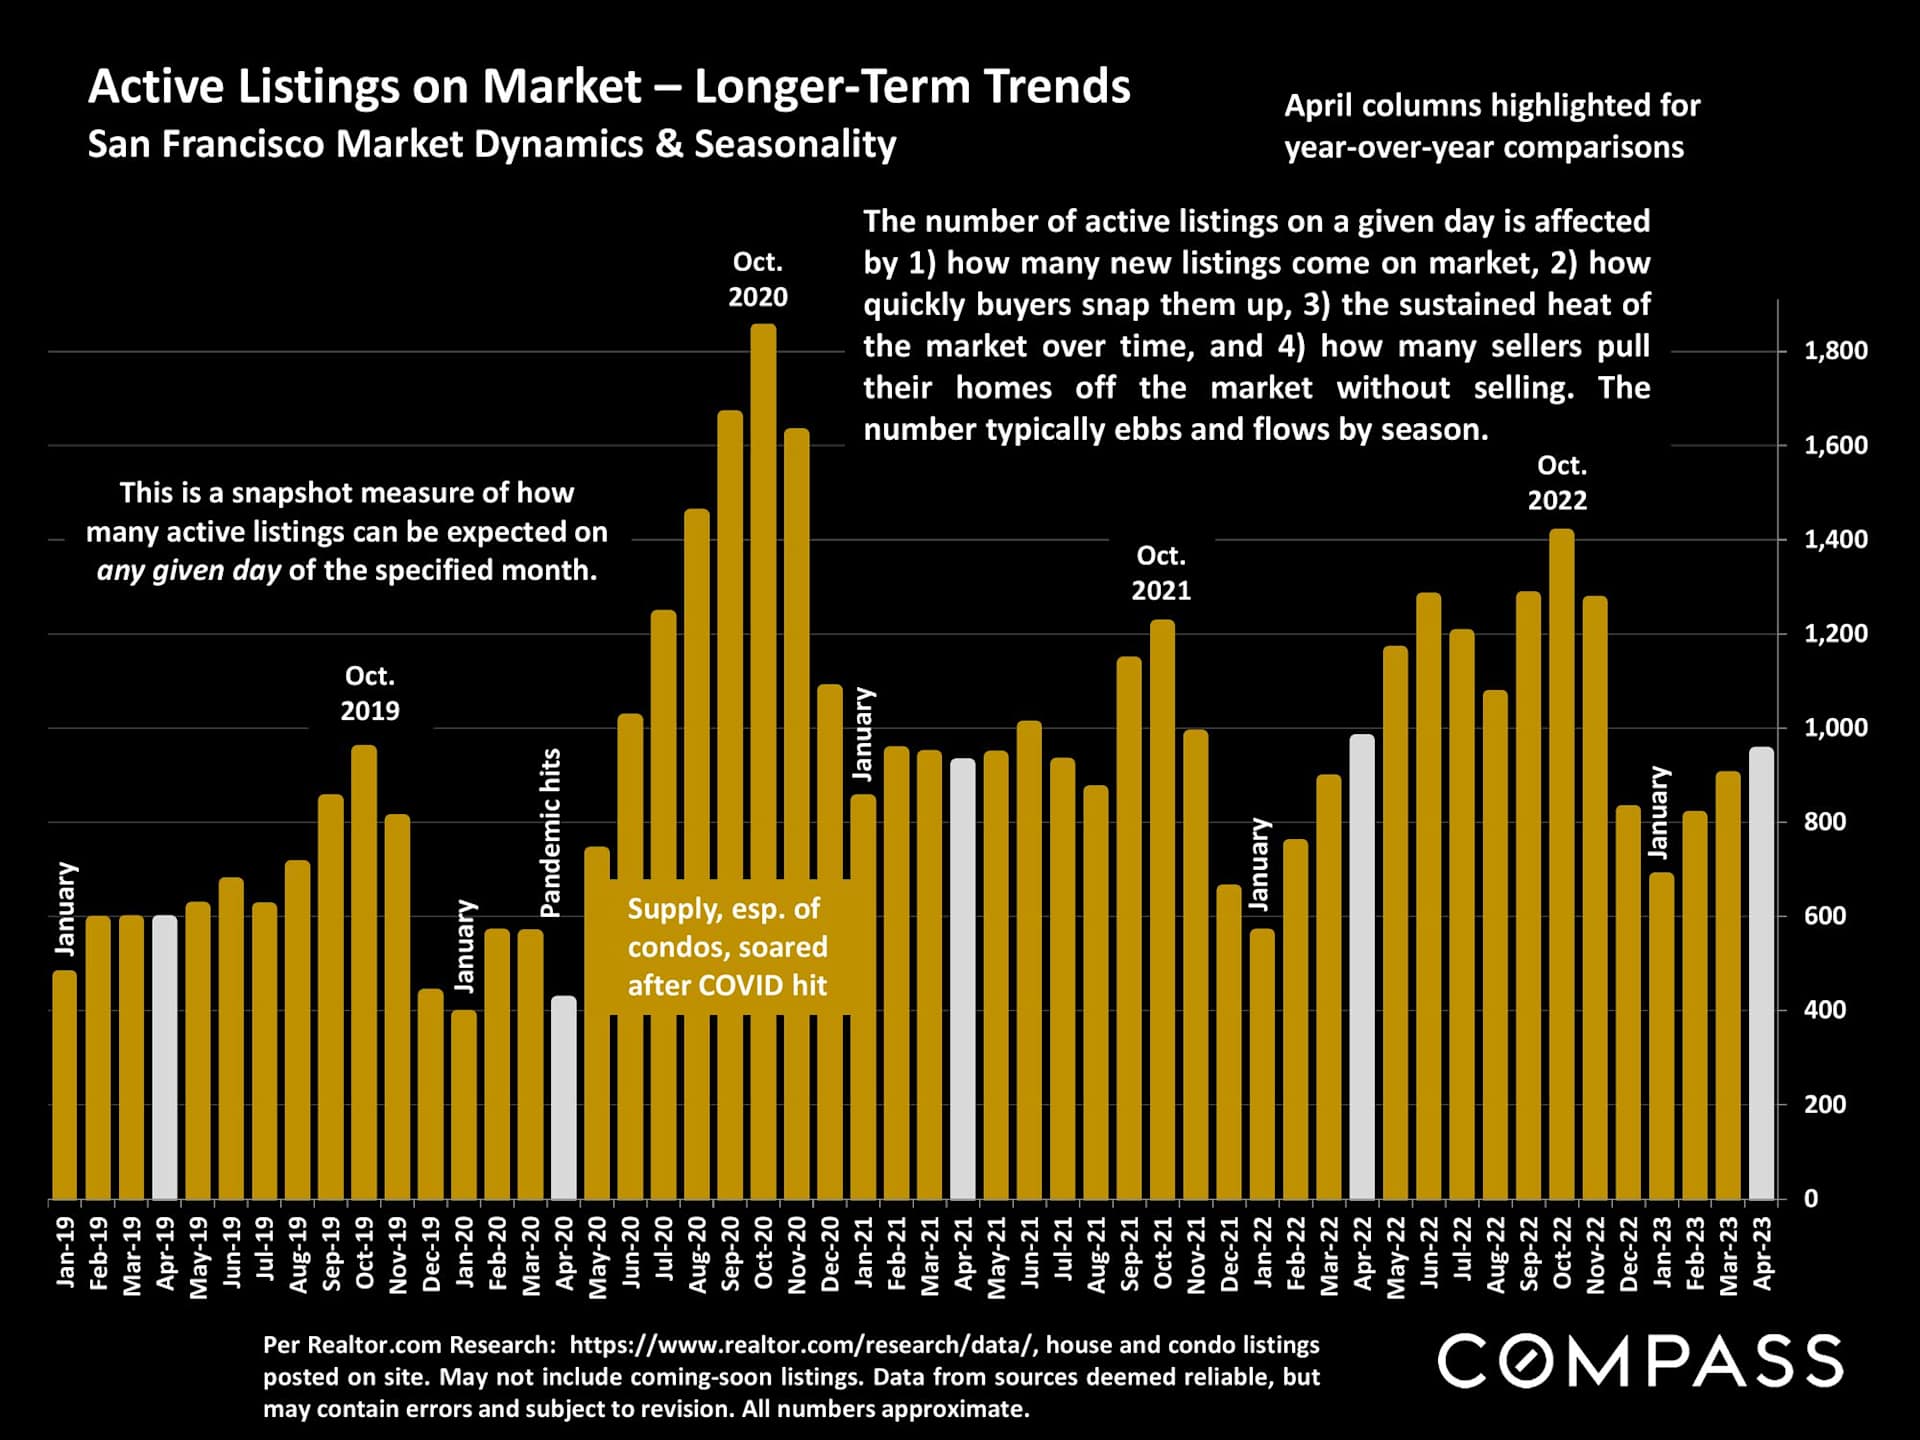
Bar chart of San Francisco active listings from January 2019 through April 2023, with April comparisons highlighted.

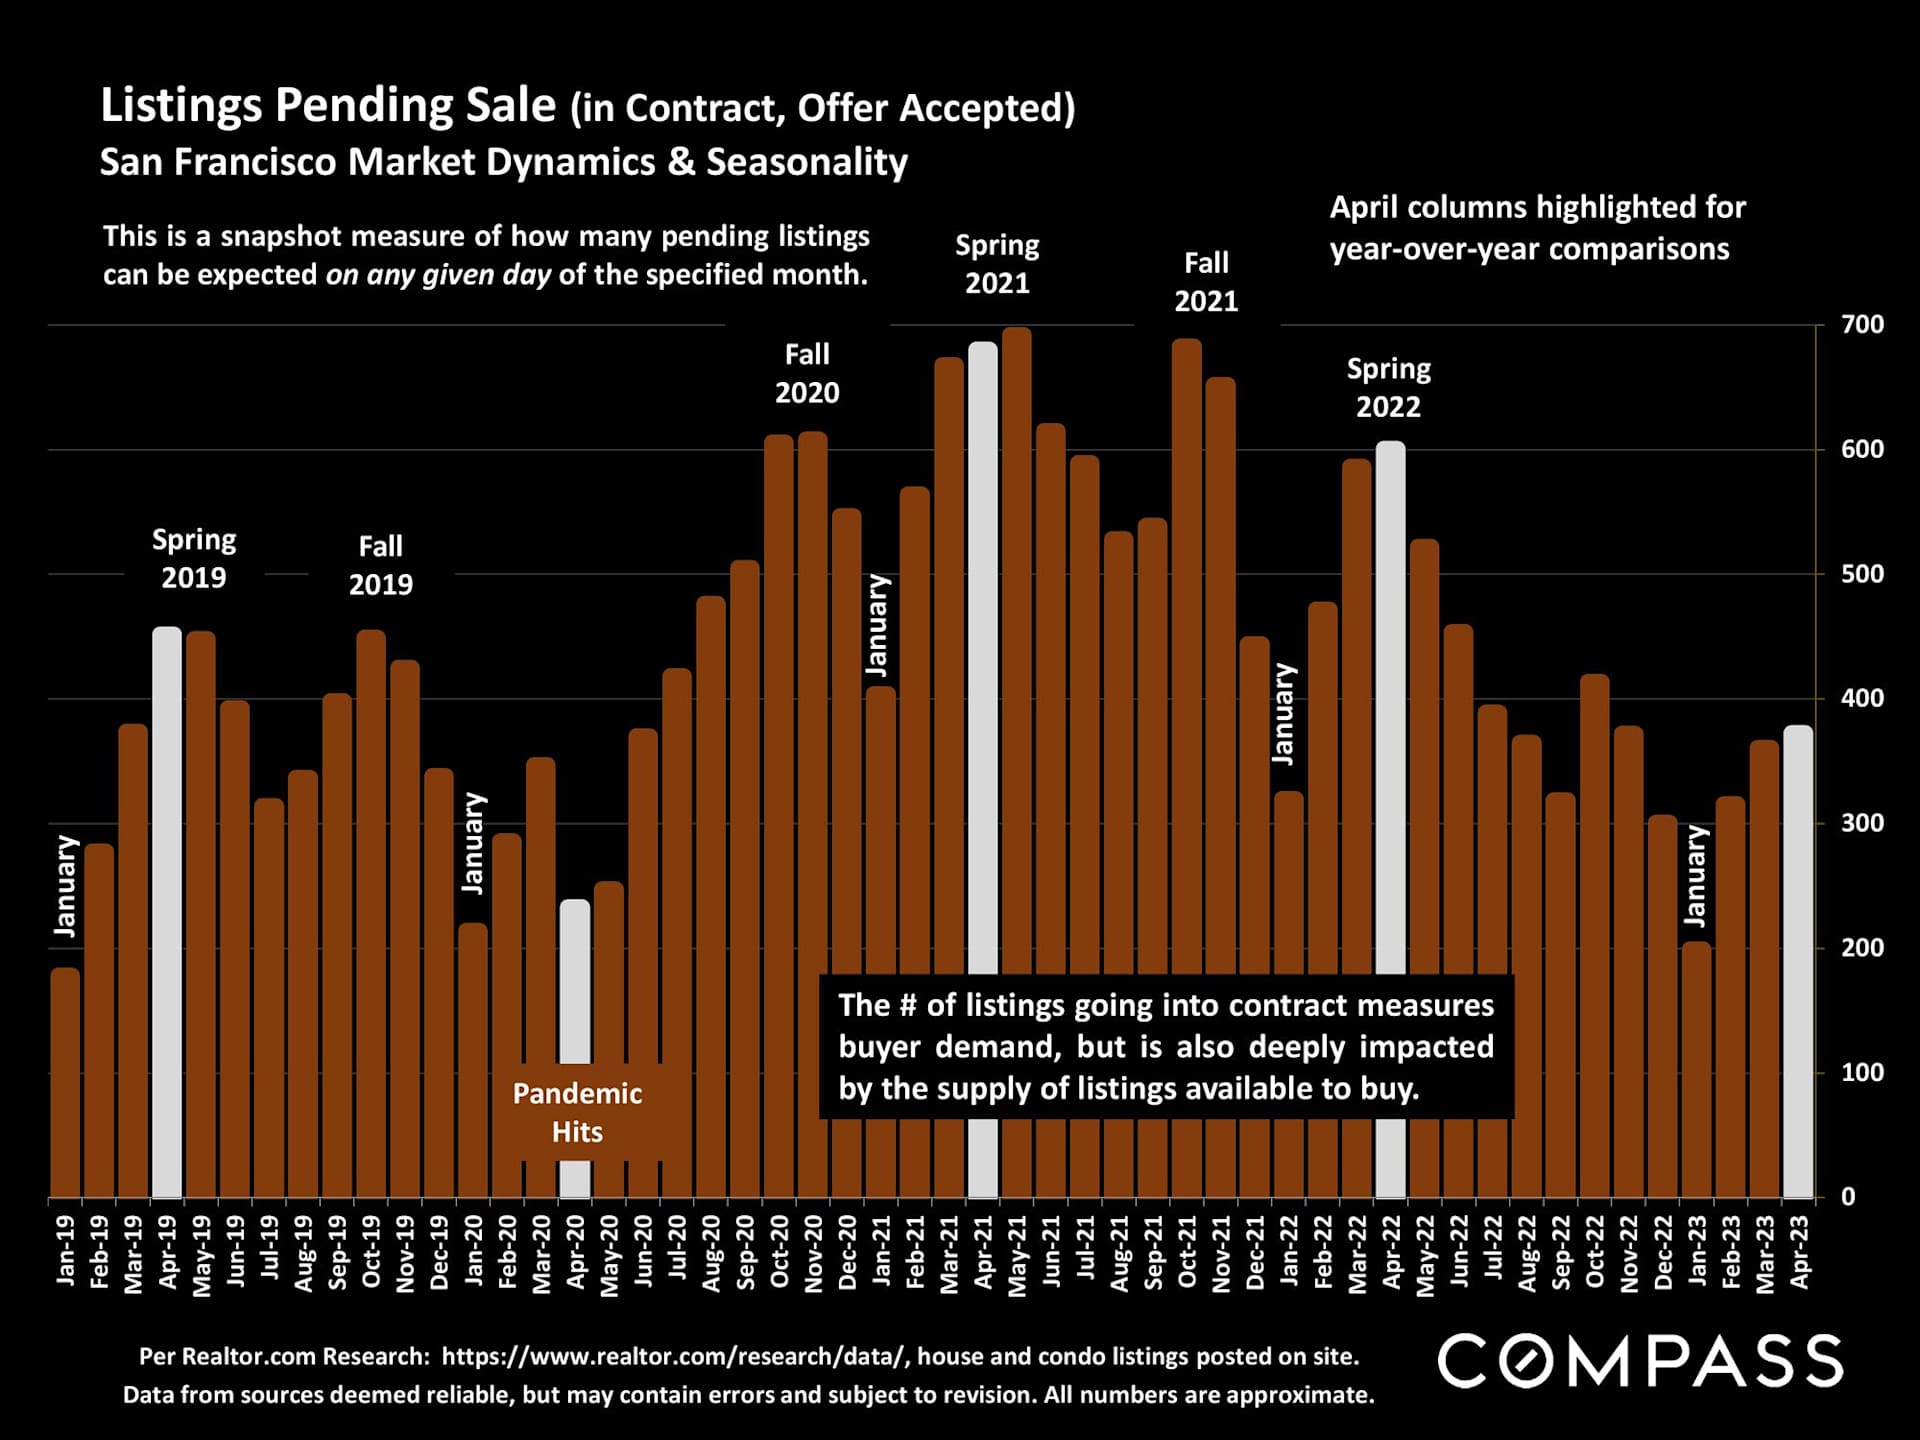
Bar chart of San Francisco pending listings from 2019 to April 2023, with April values highlighted.

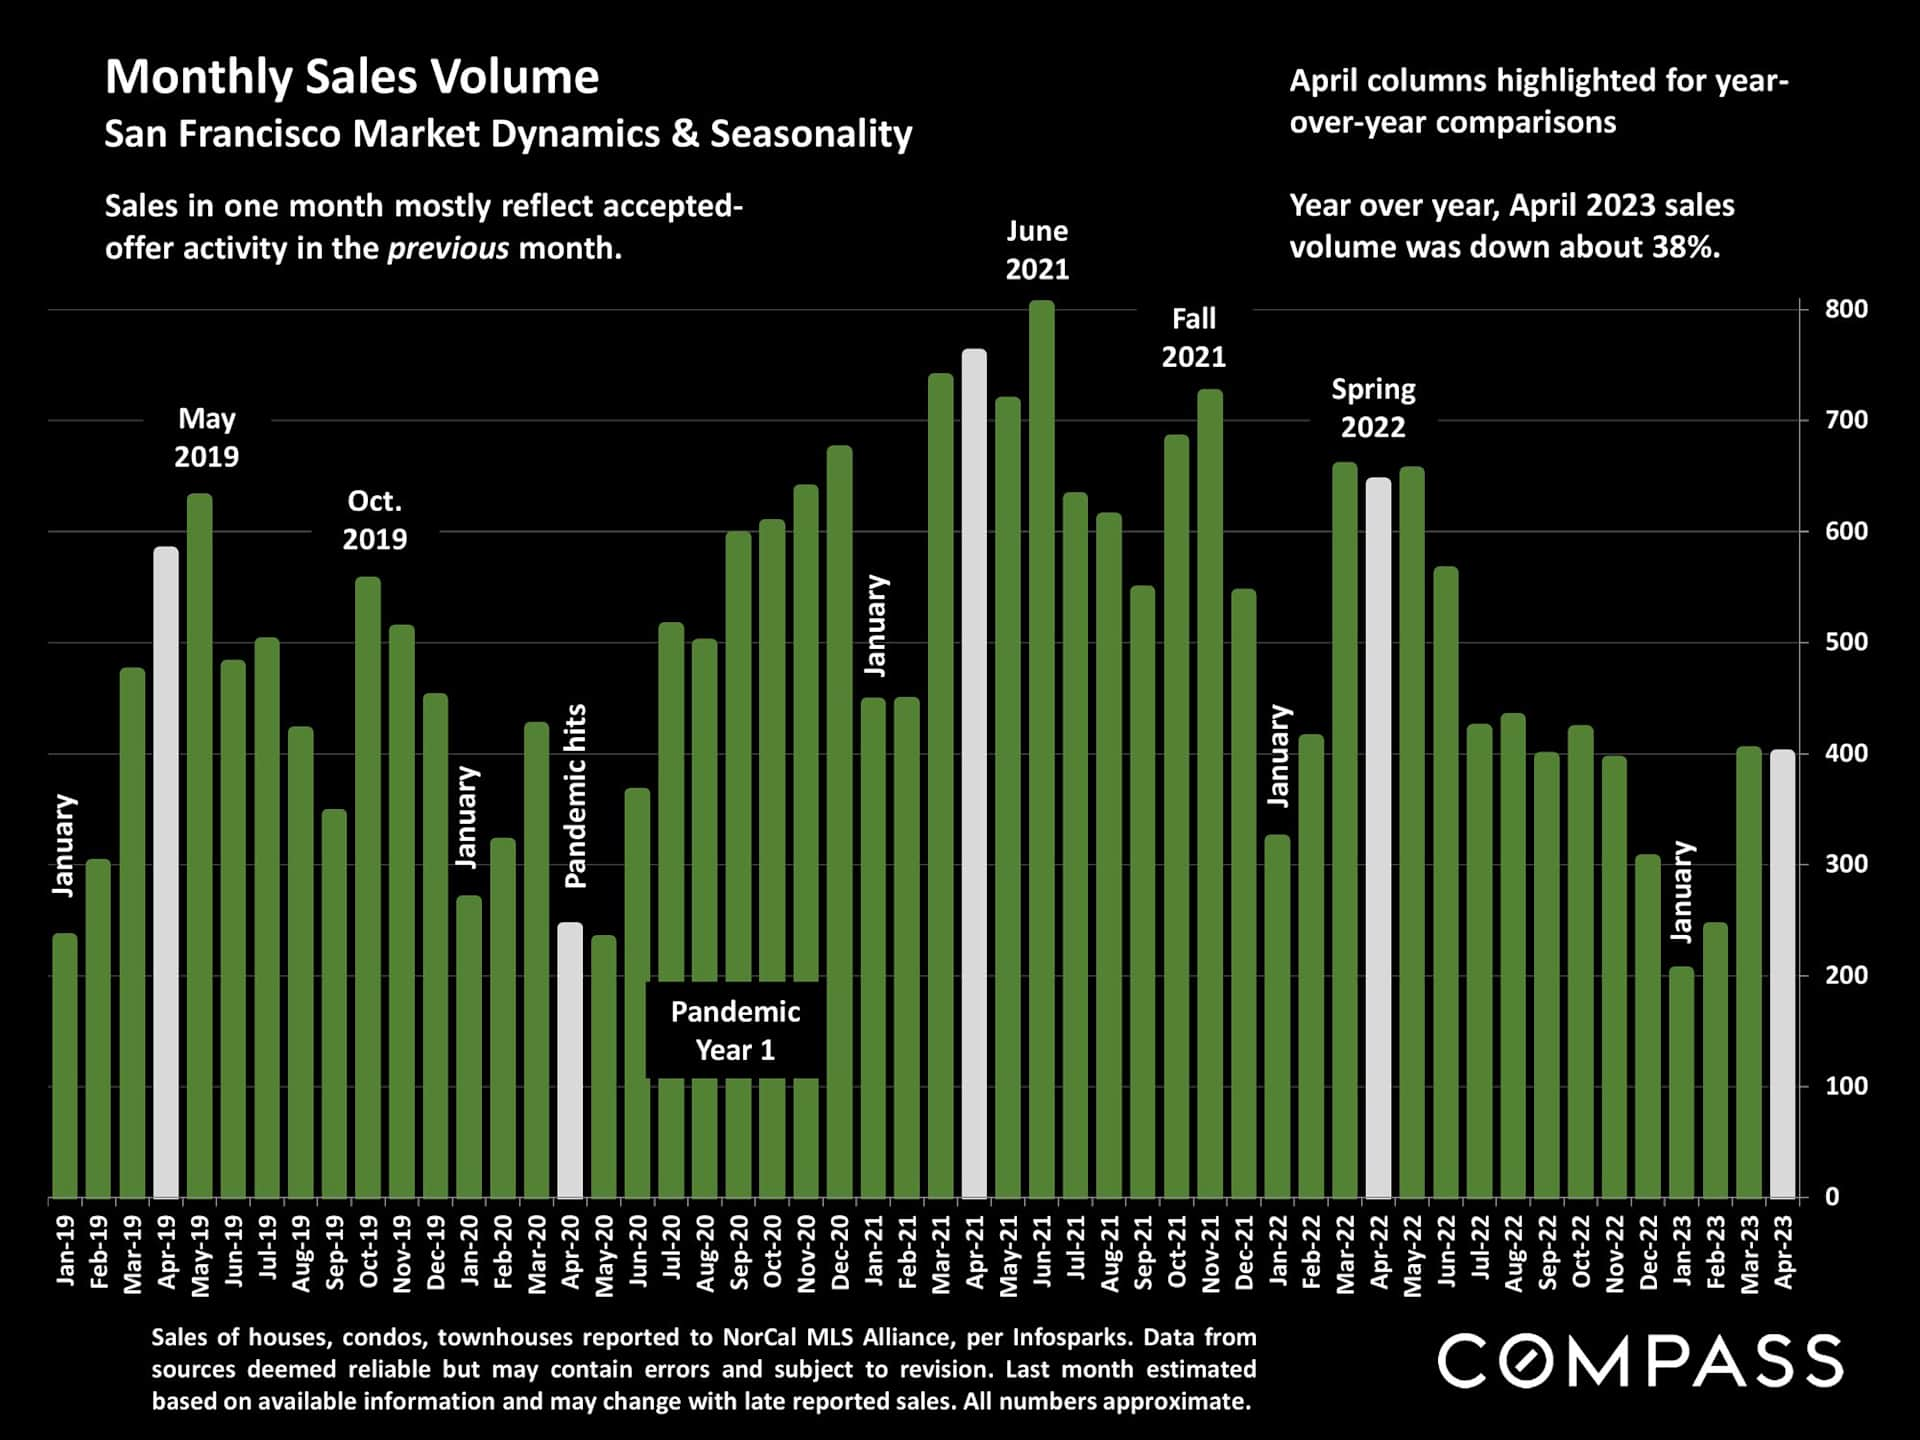
Chart of San Francisco monthly home sales from 2019 to April 2023, highlighting April sales and pandemic-era trends.

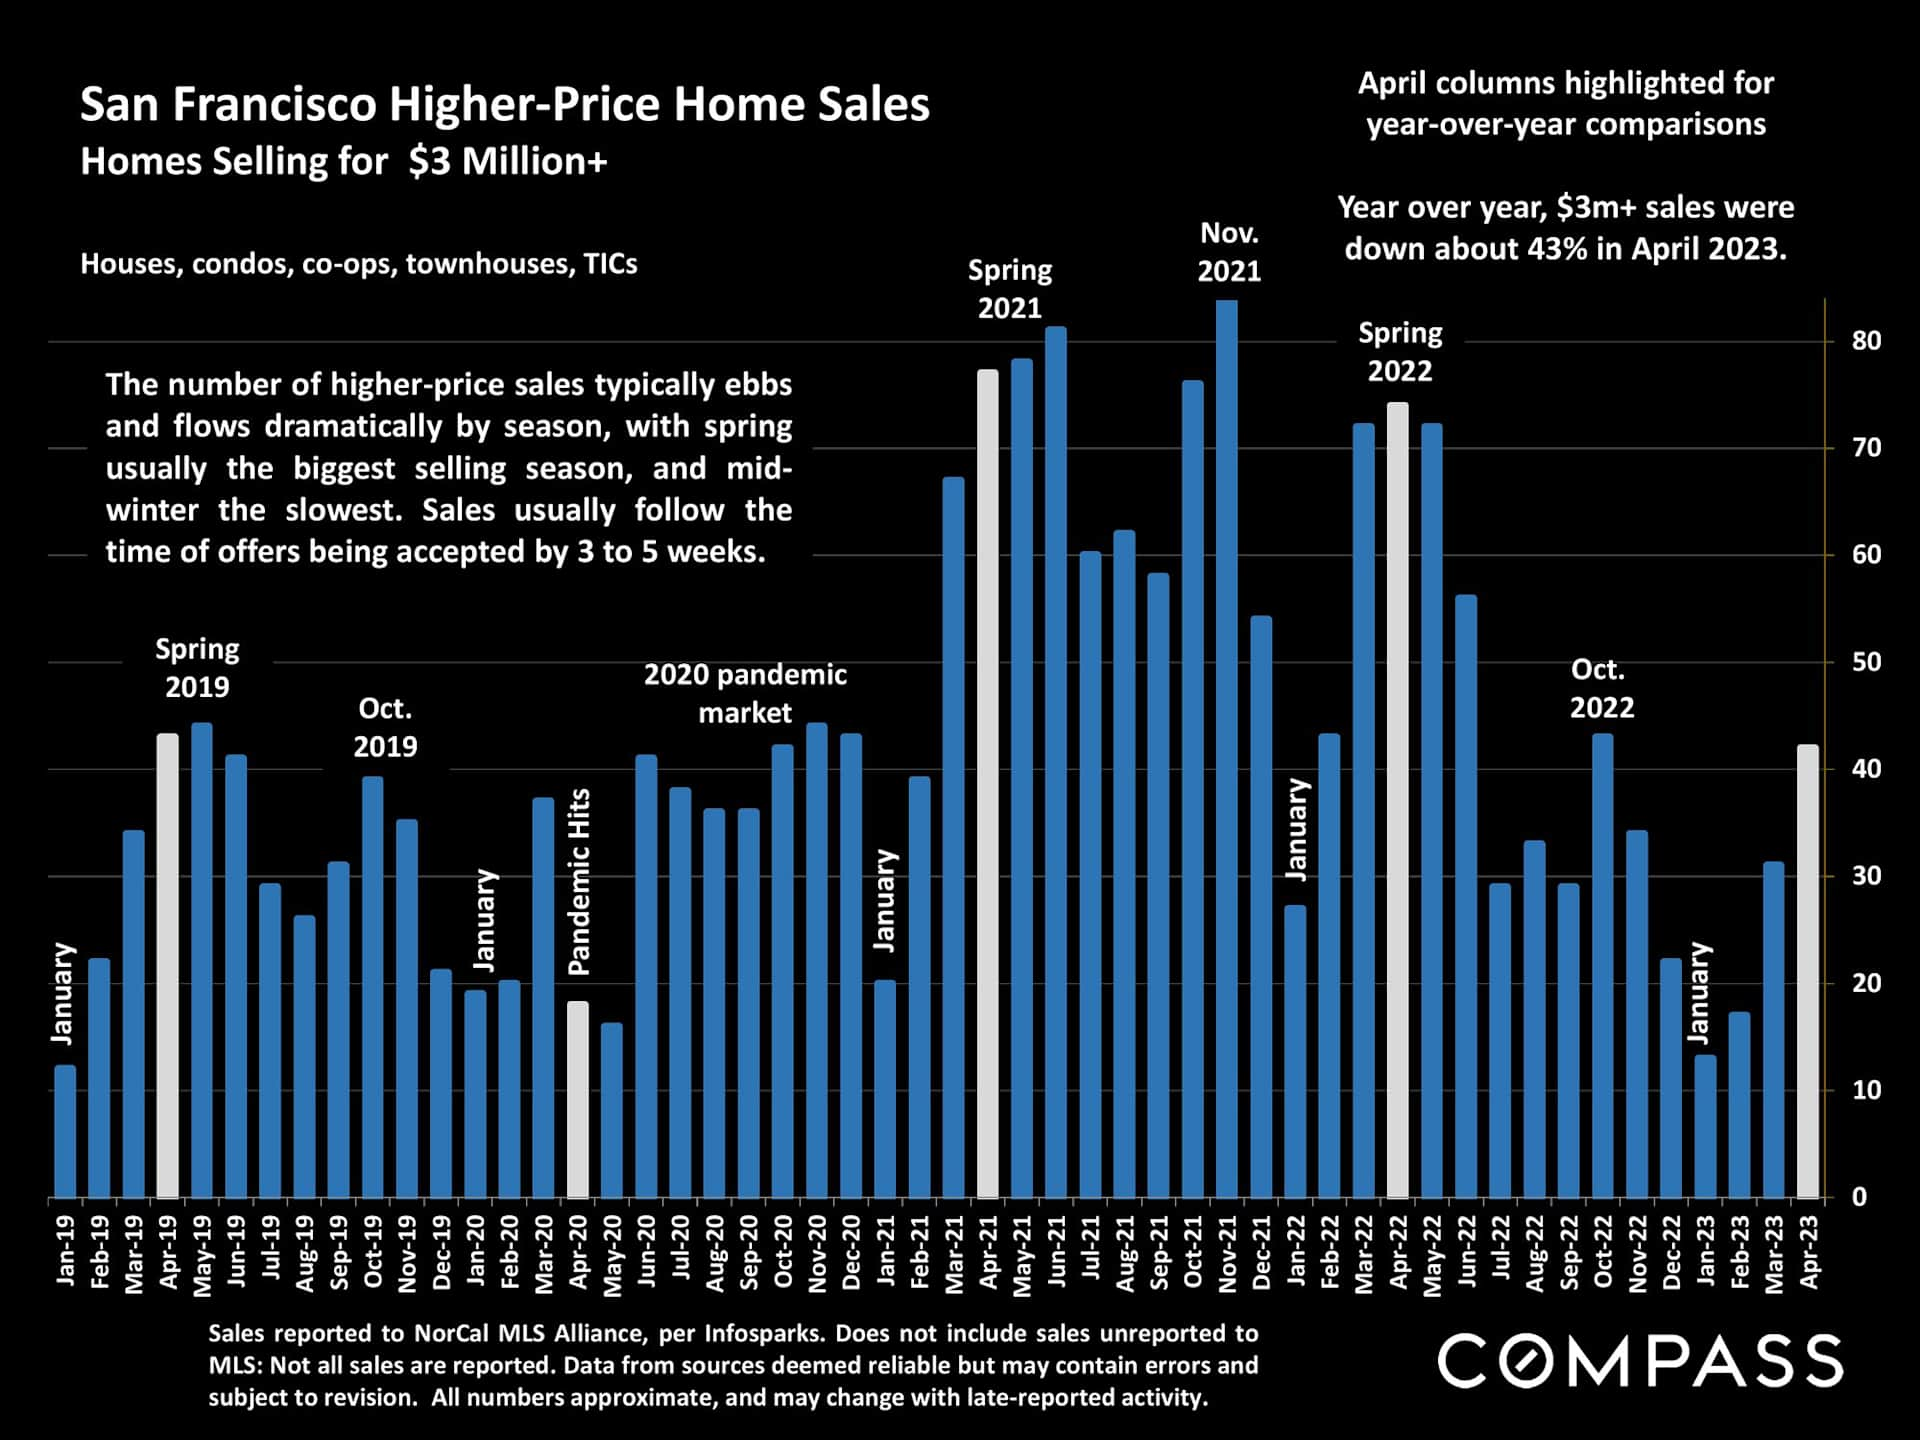
Chart of San Francisco home sales over $3 million, January 2019–April 2023, with April 2023 sales down 43% year over year.

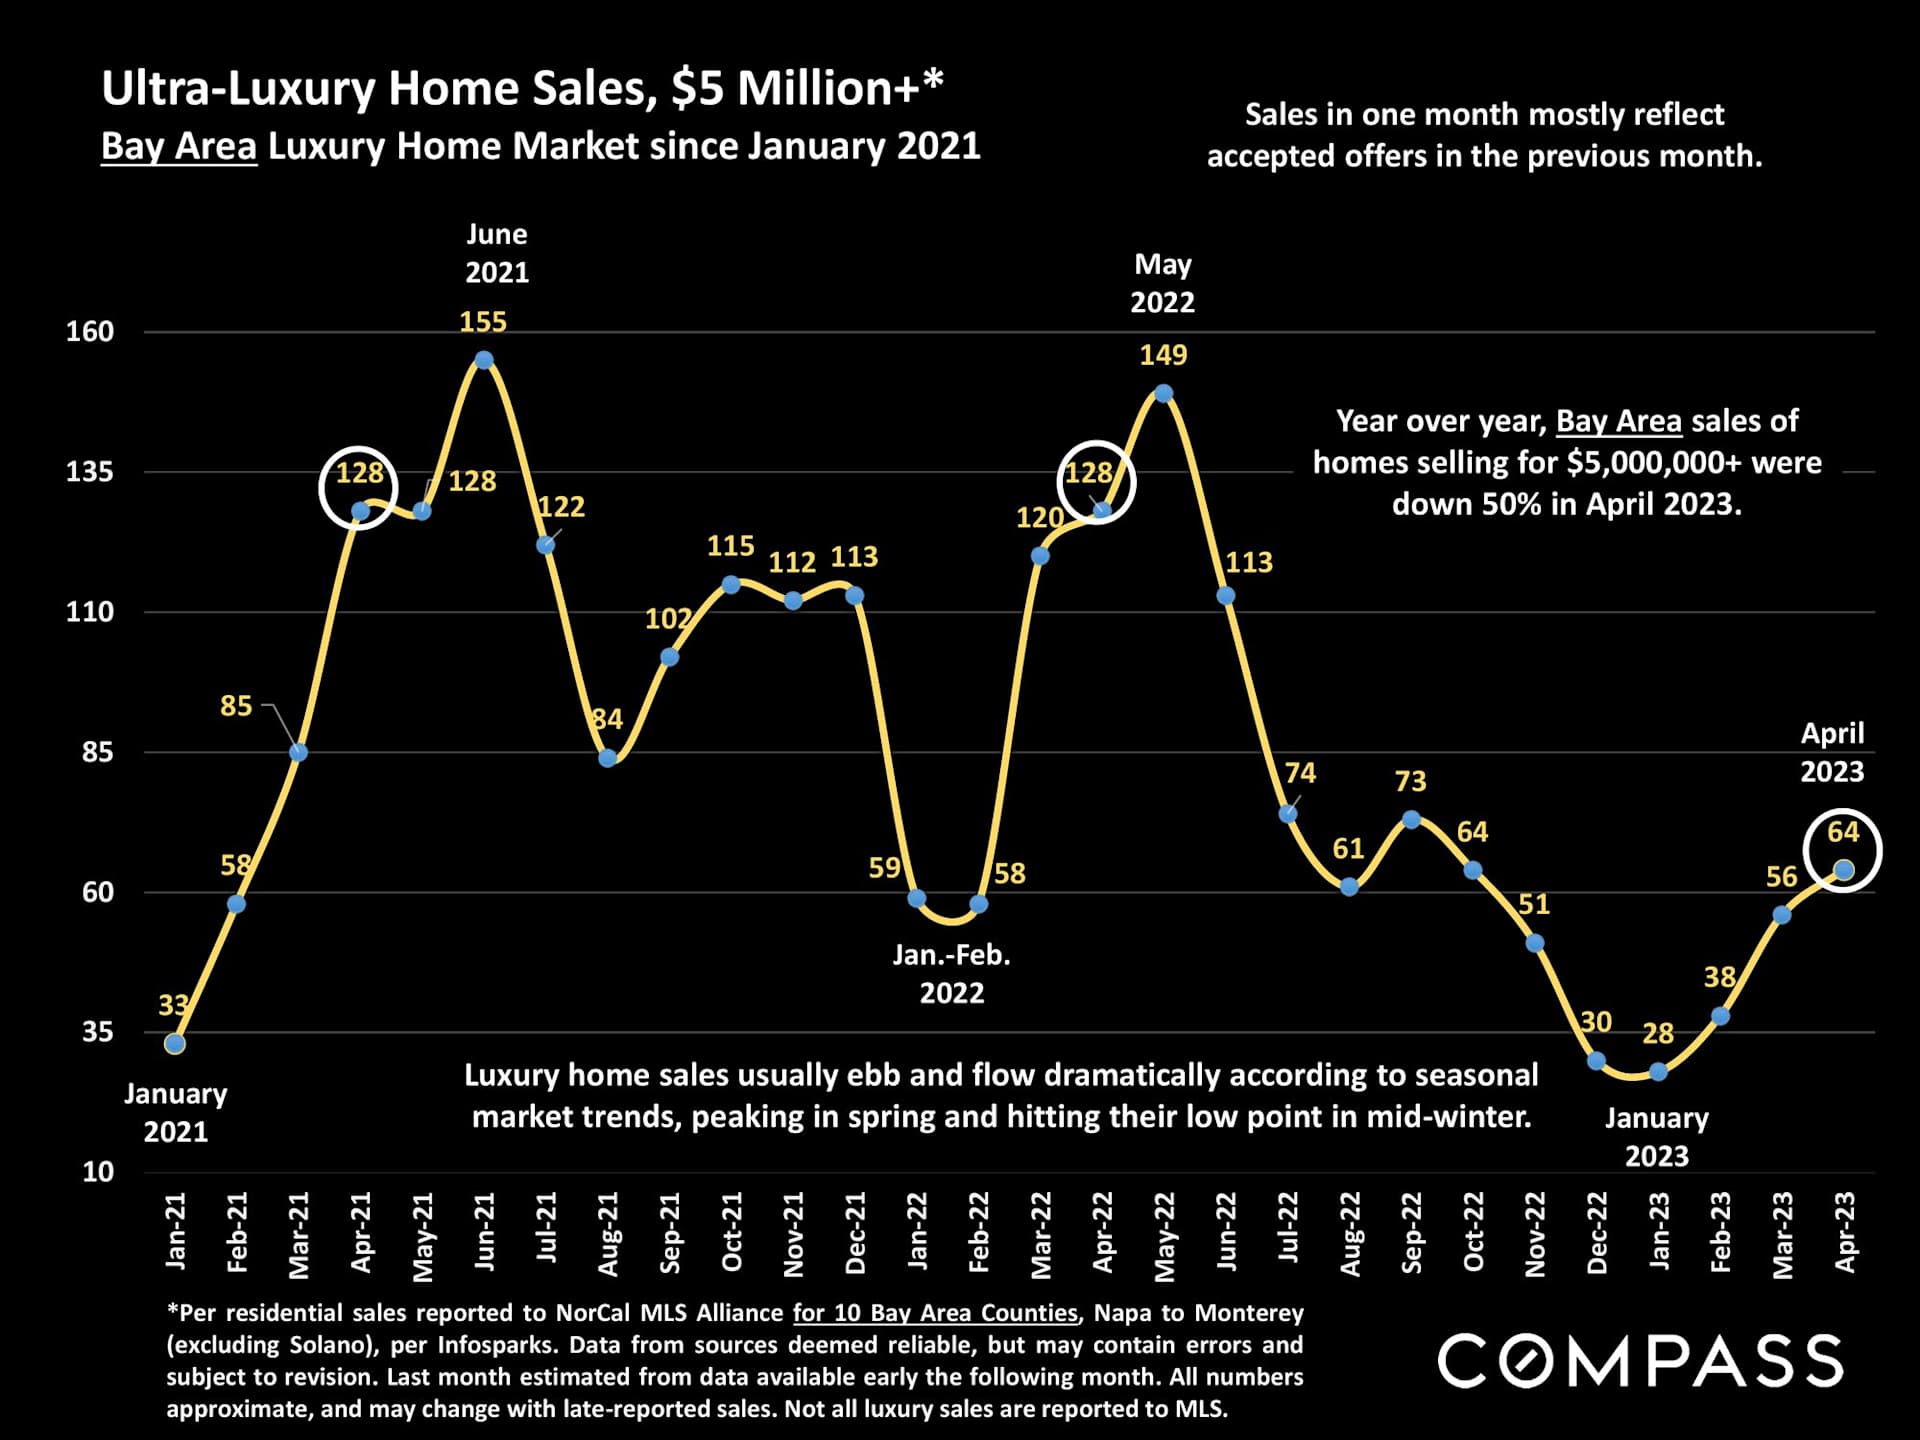
Chart of Bay Area ultra-luxury home sales from January 2021 to April 2023, highlighting 64 sales in April 2023.

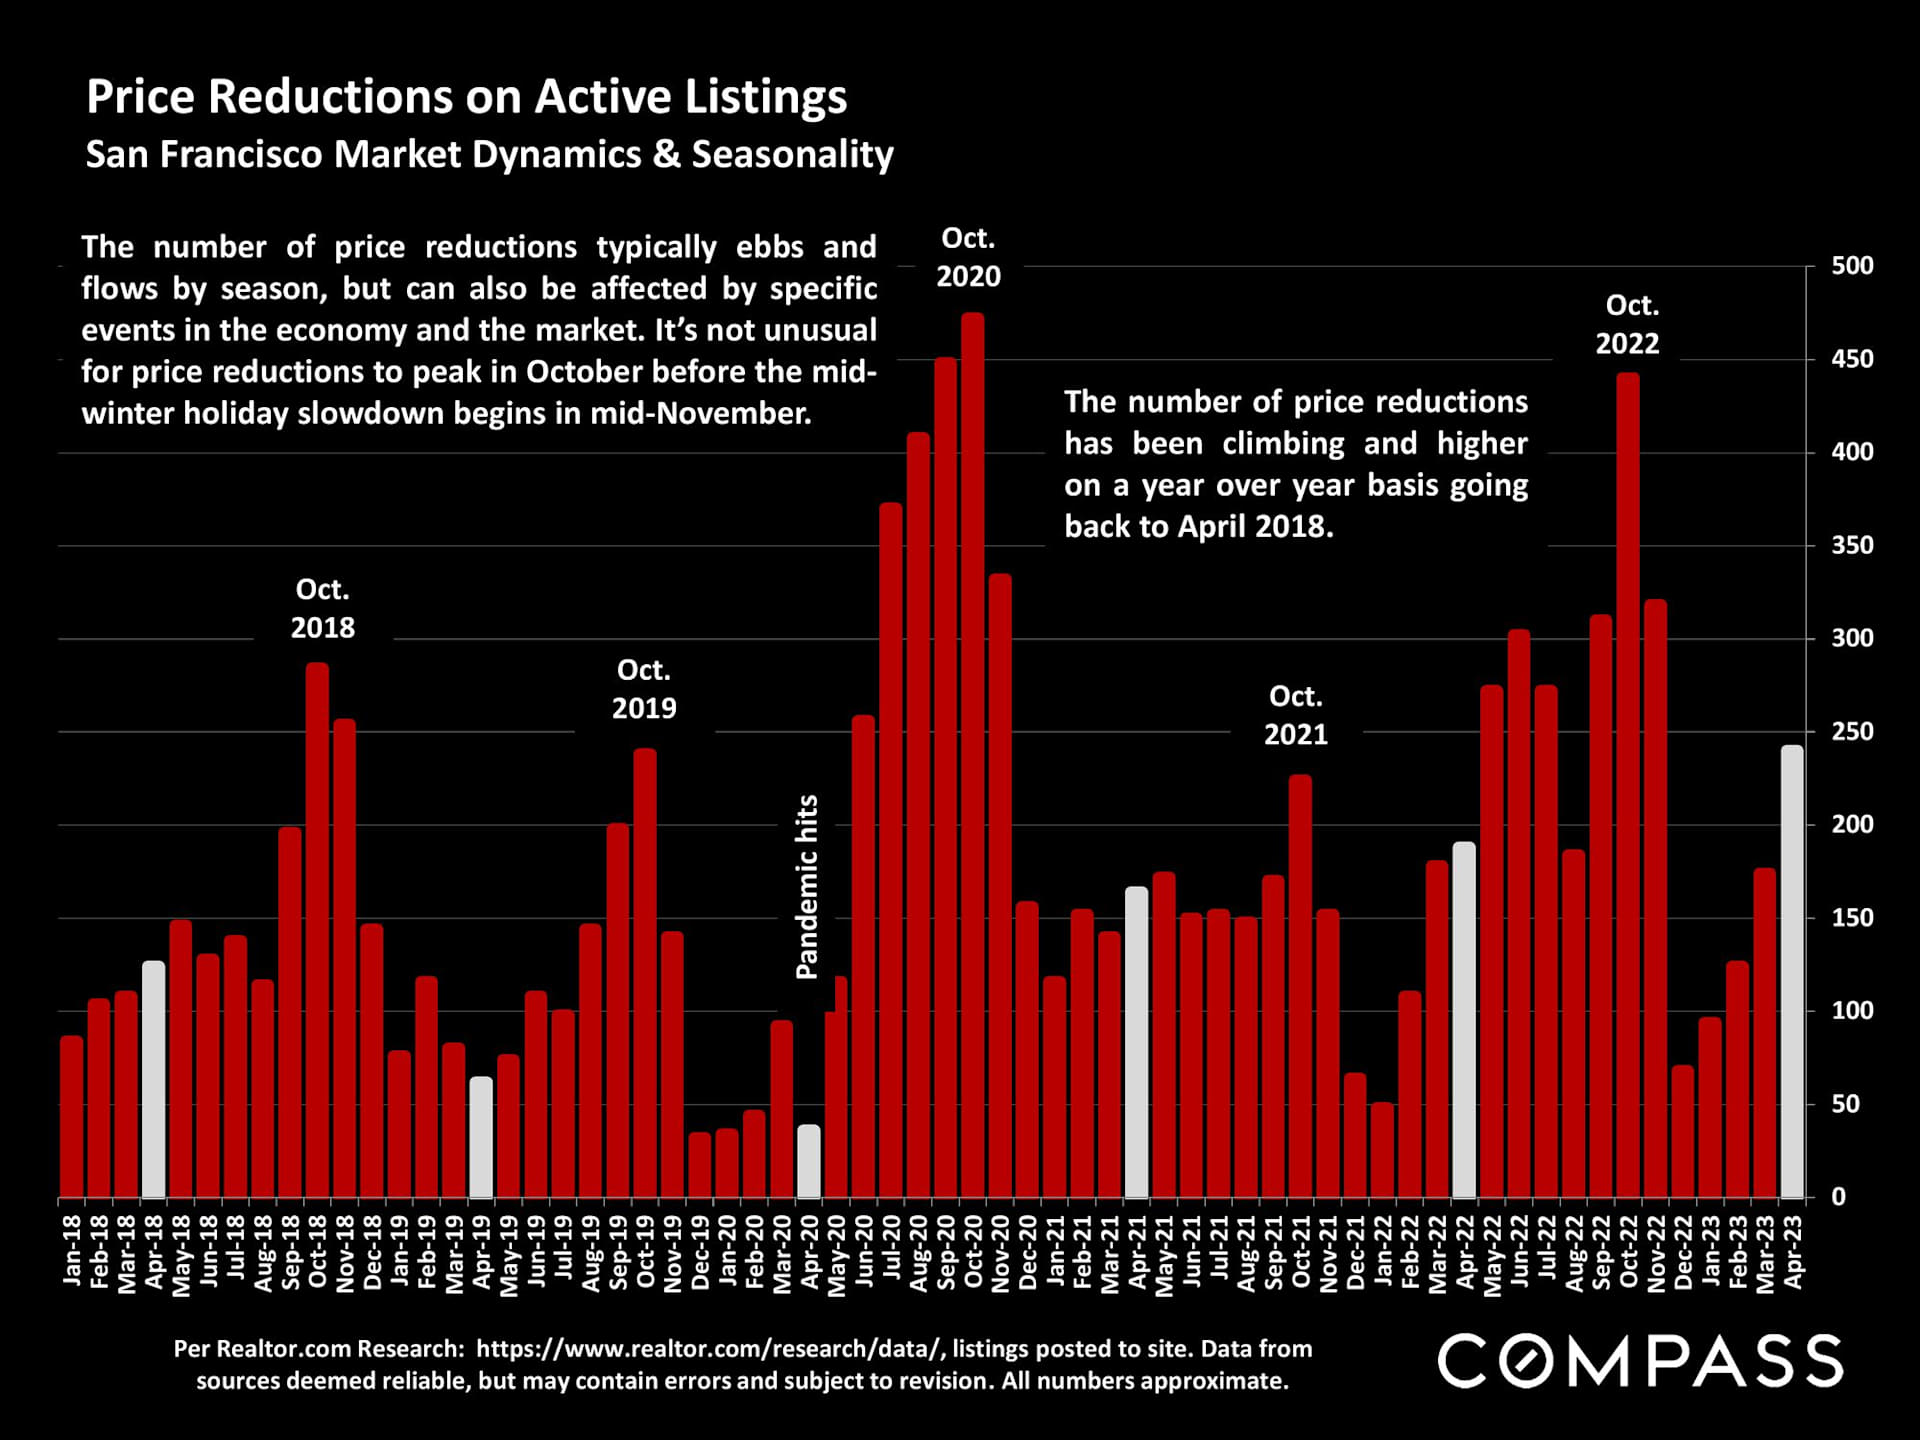
Bar chart of San Francisco listing price reductions, January 2018–April 2023, with October peaks and a pandemic marker.

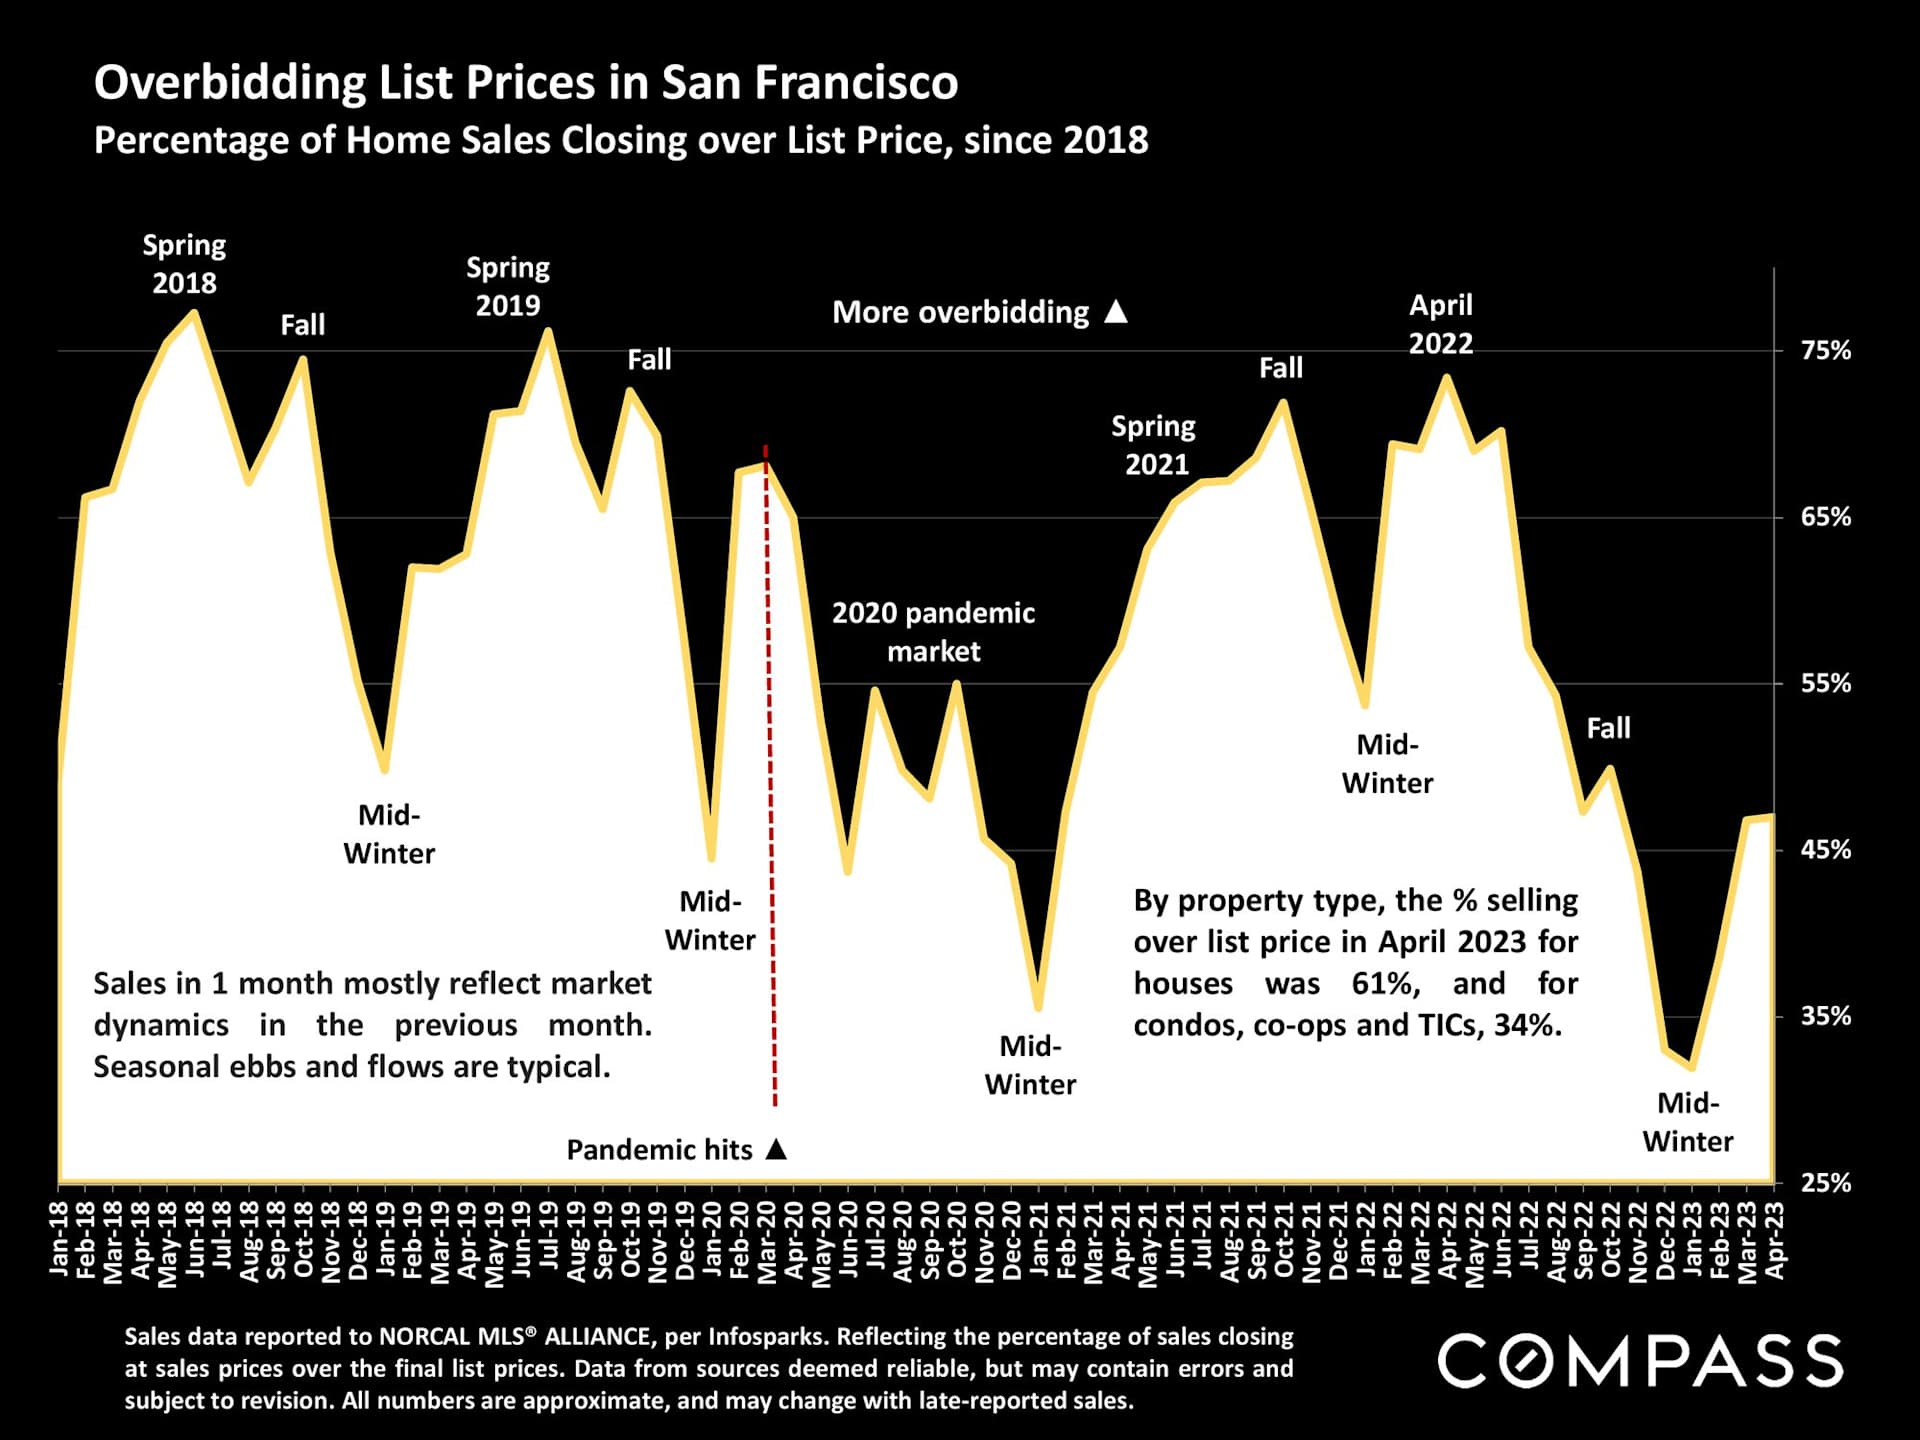
Chart of San Francisco home sales over list price, with monthly trends from 2018 to April 2023.

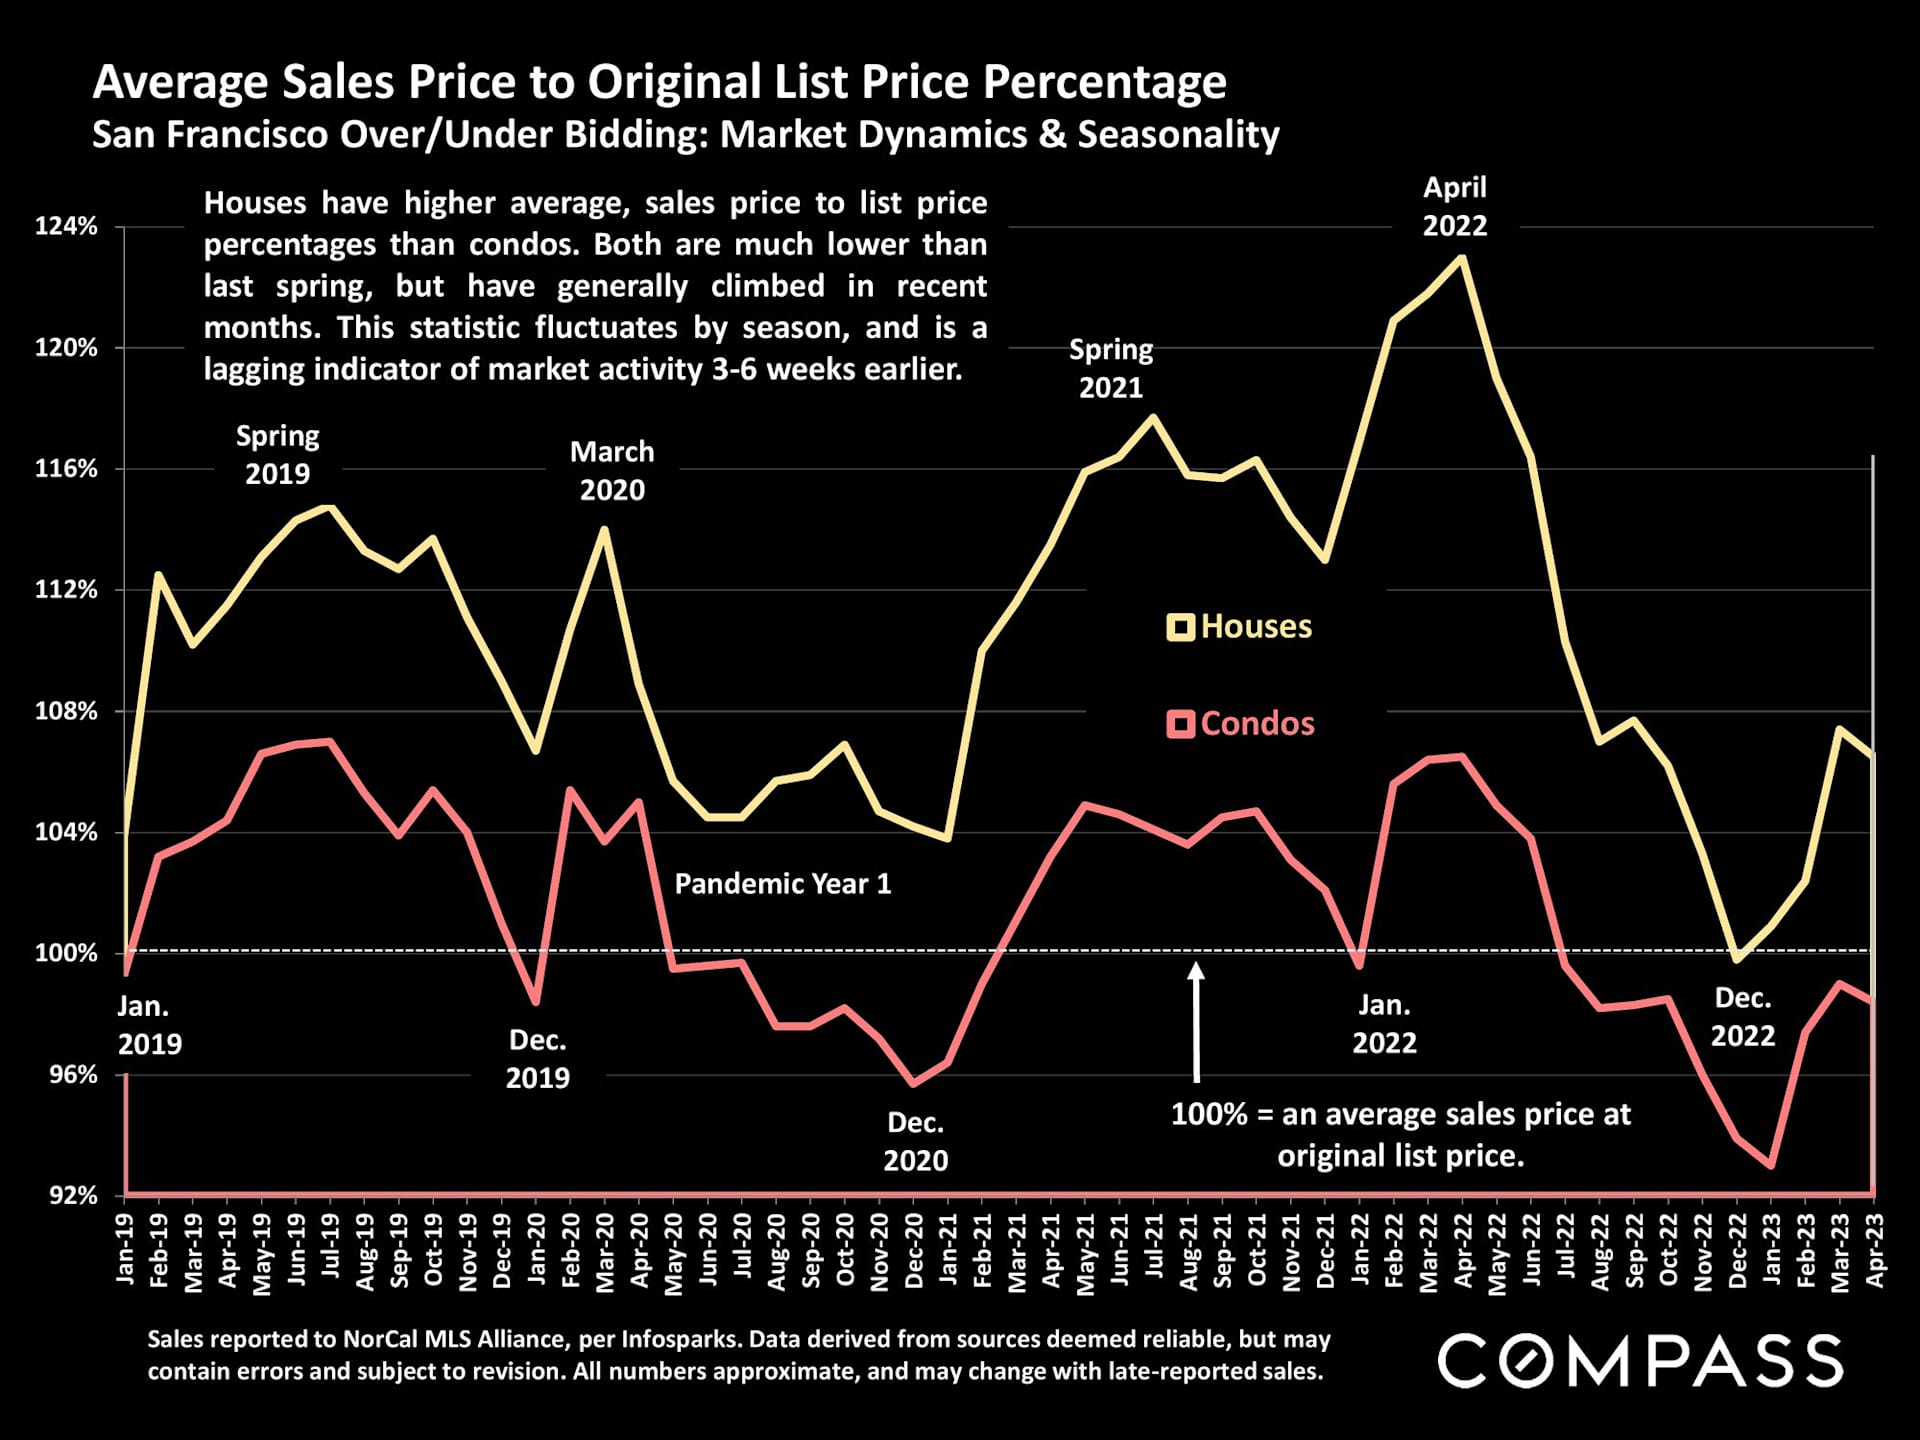
Line chart comparing San Francisco house and condo sale prices to original list prices, January 2019–April 2023.

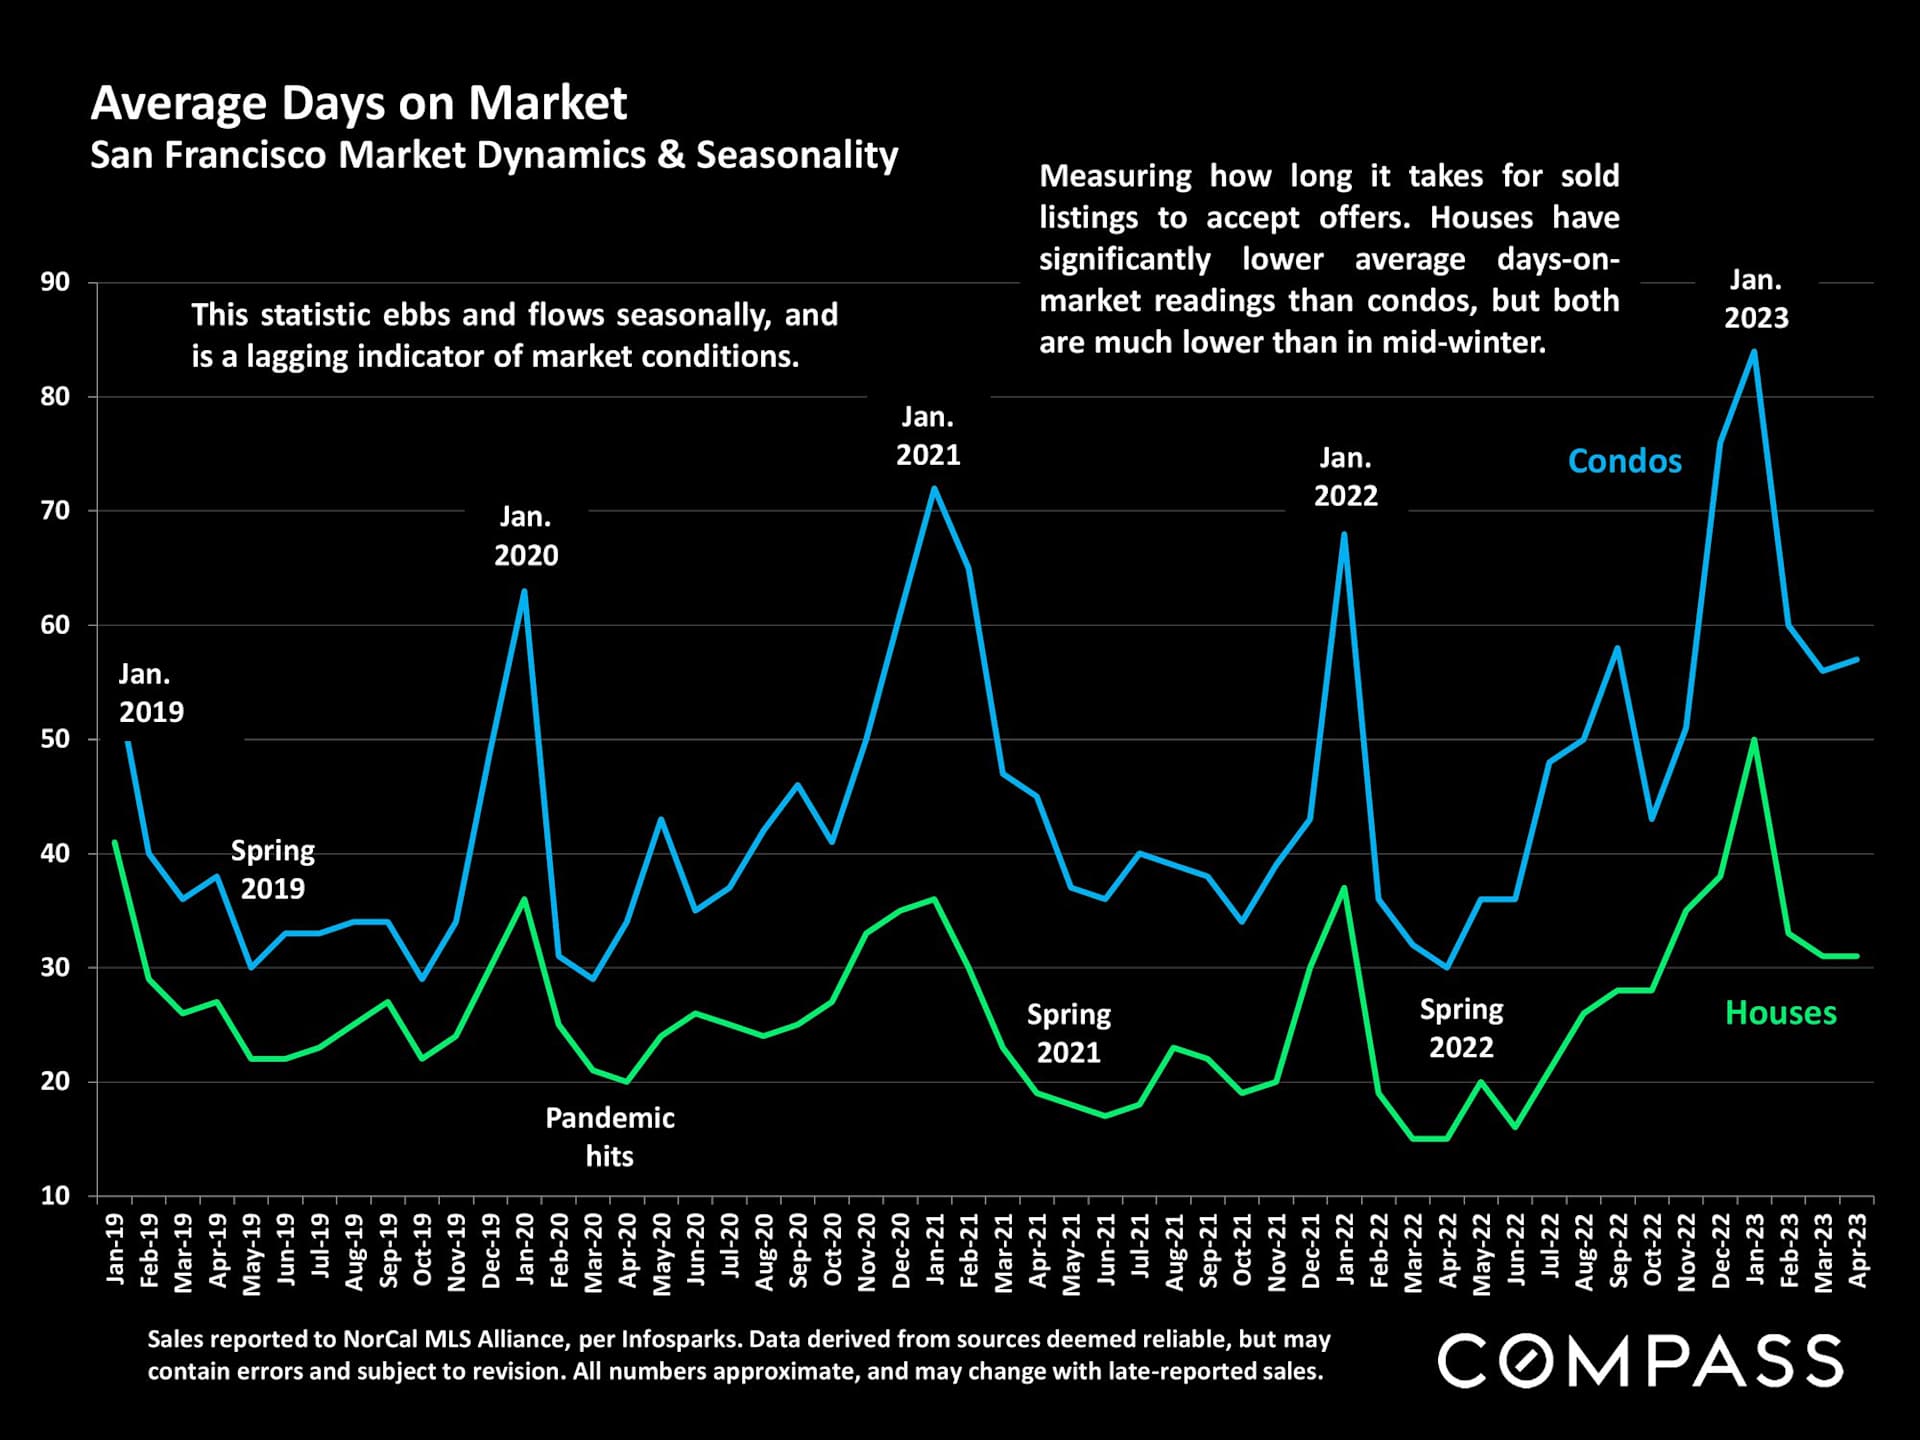
San Francisco chart comparing average days on market for condos and houses from 2019 through April 2023.

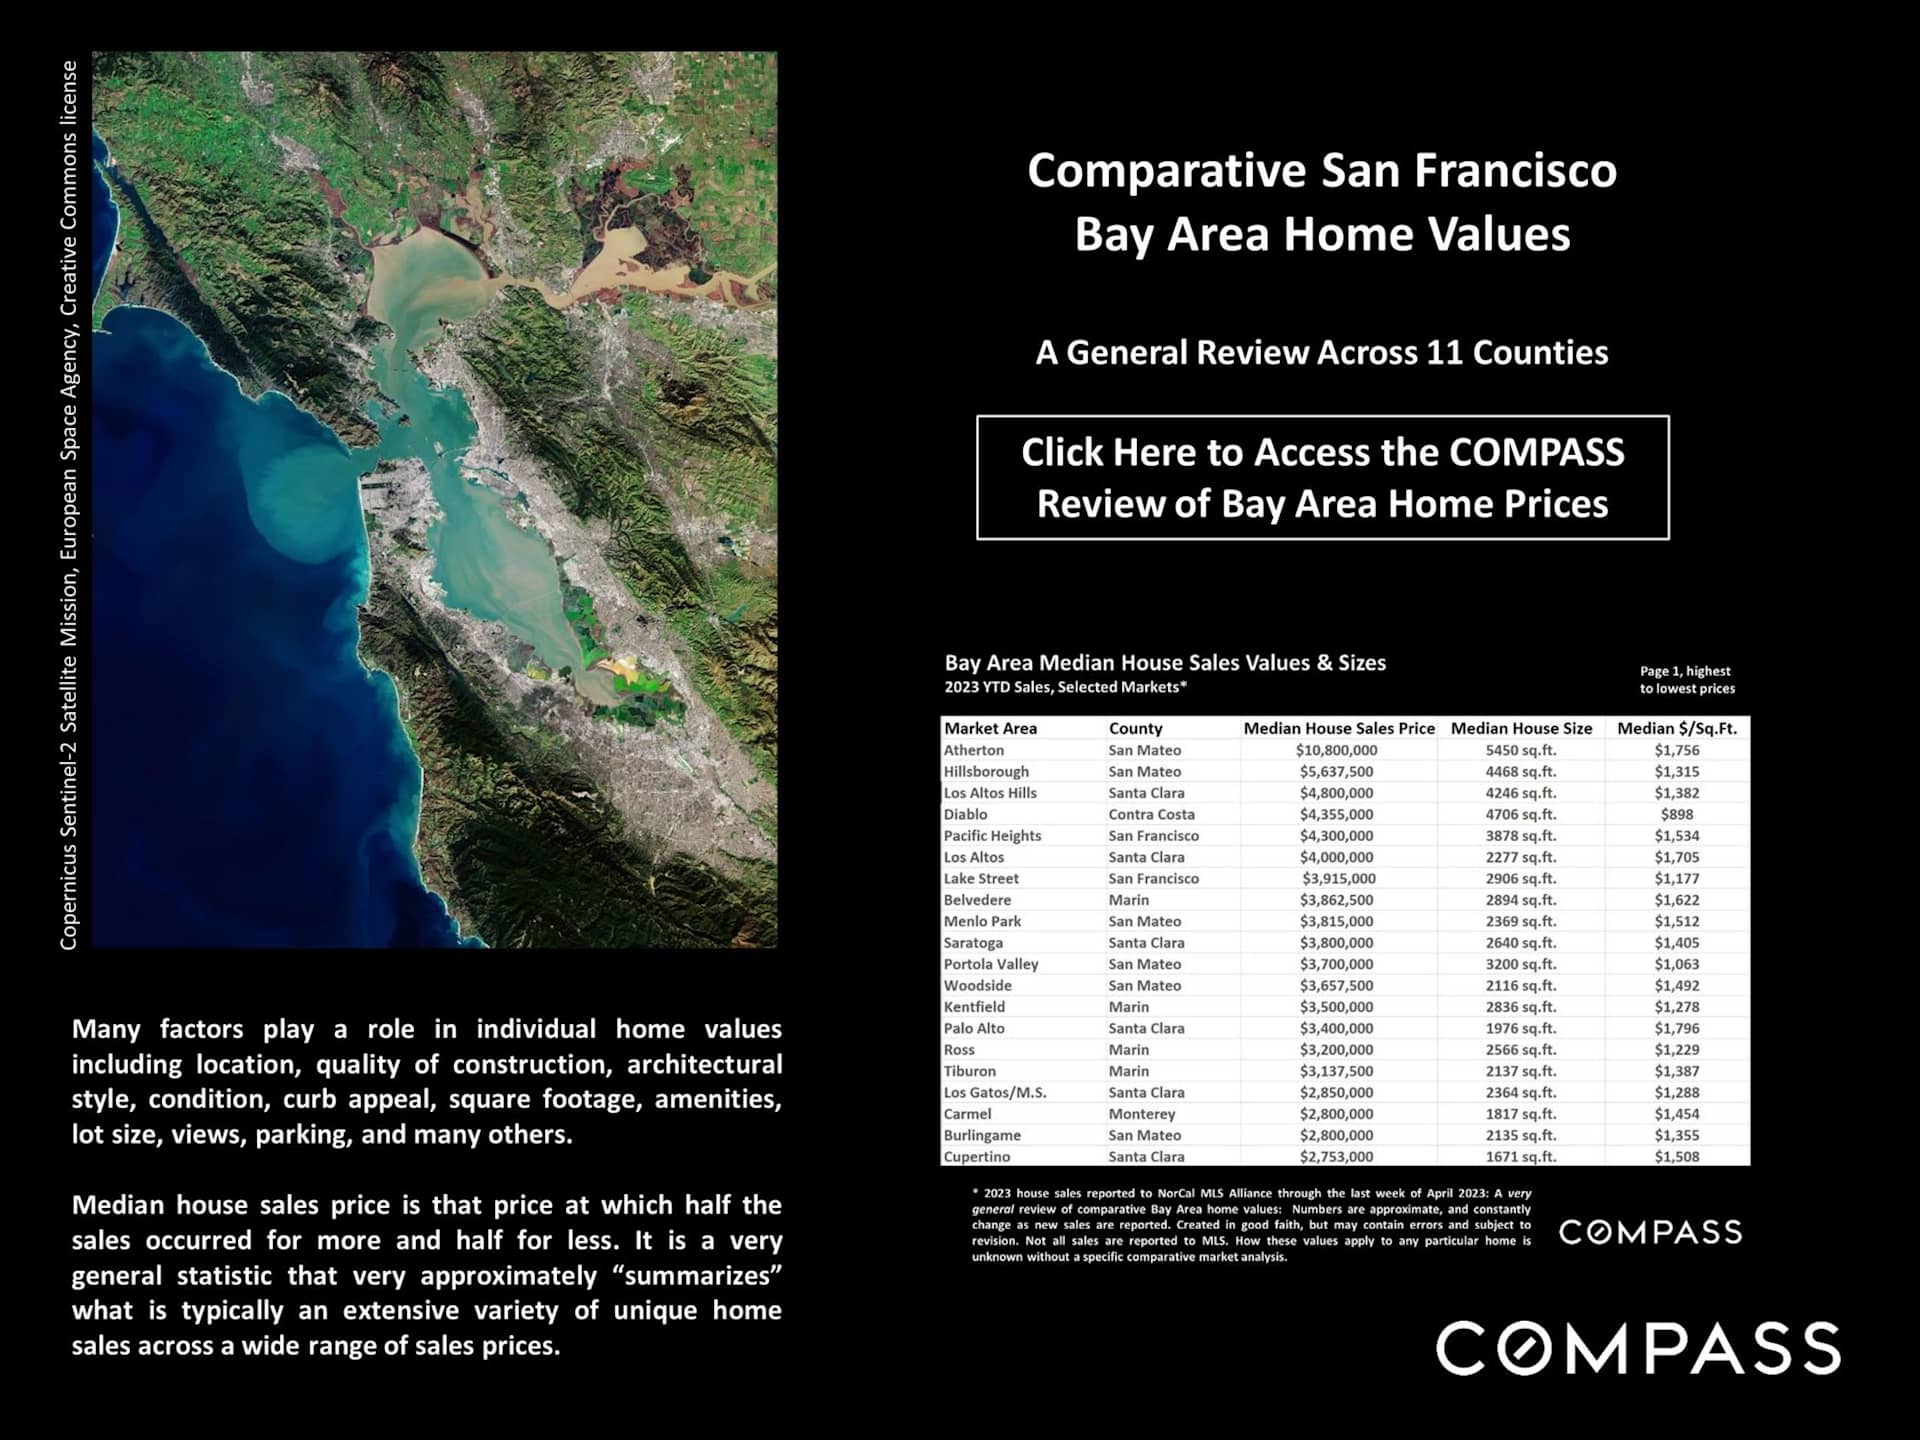
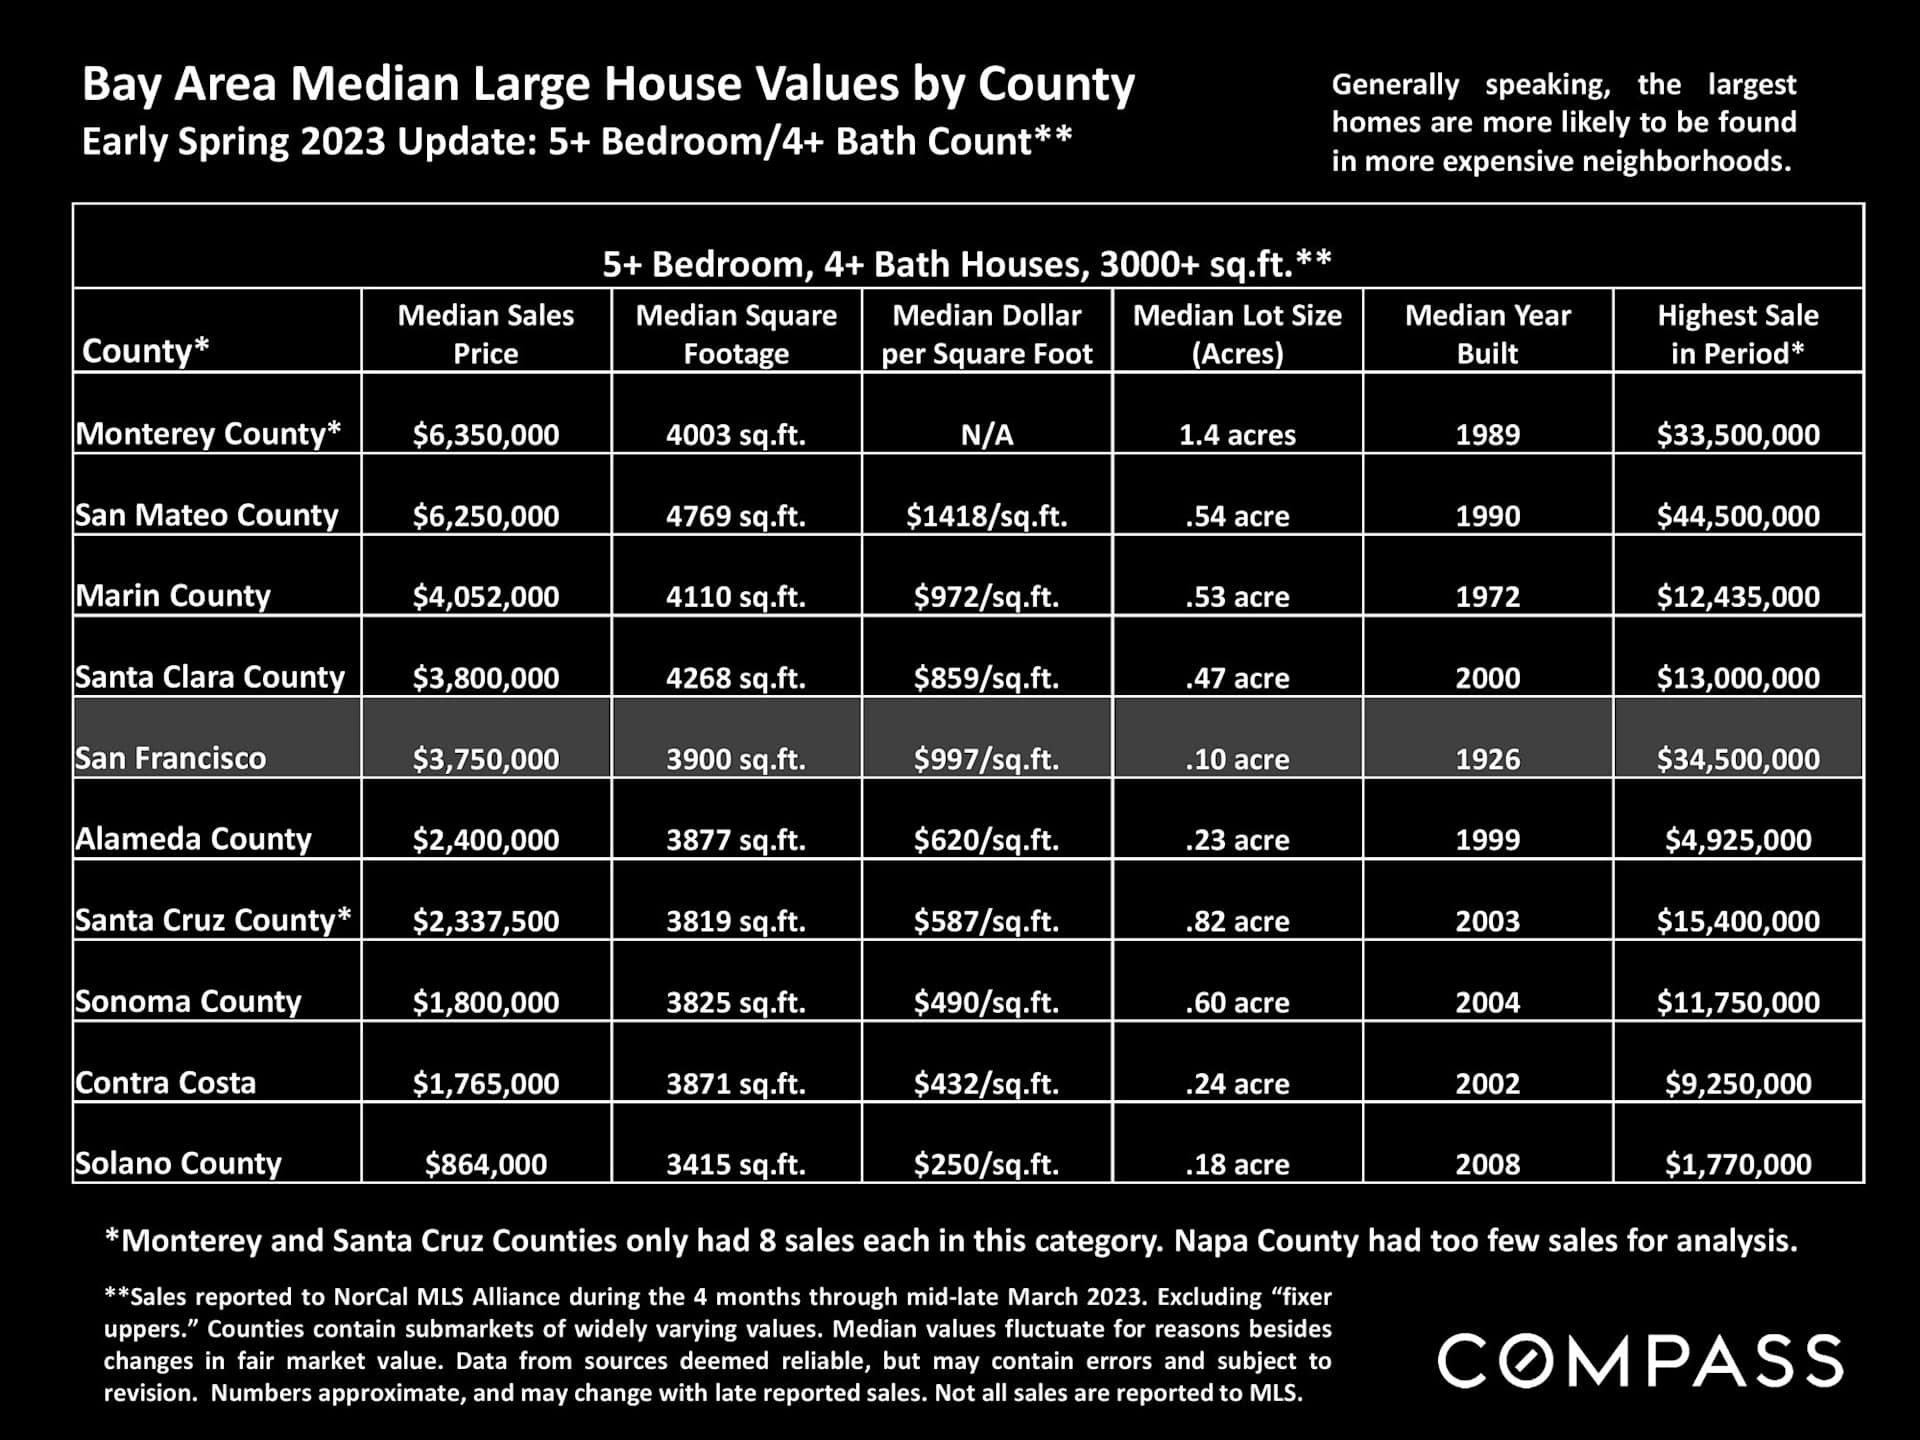
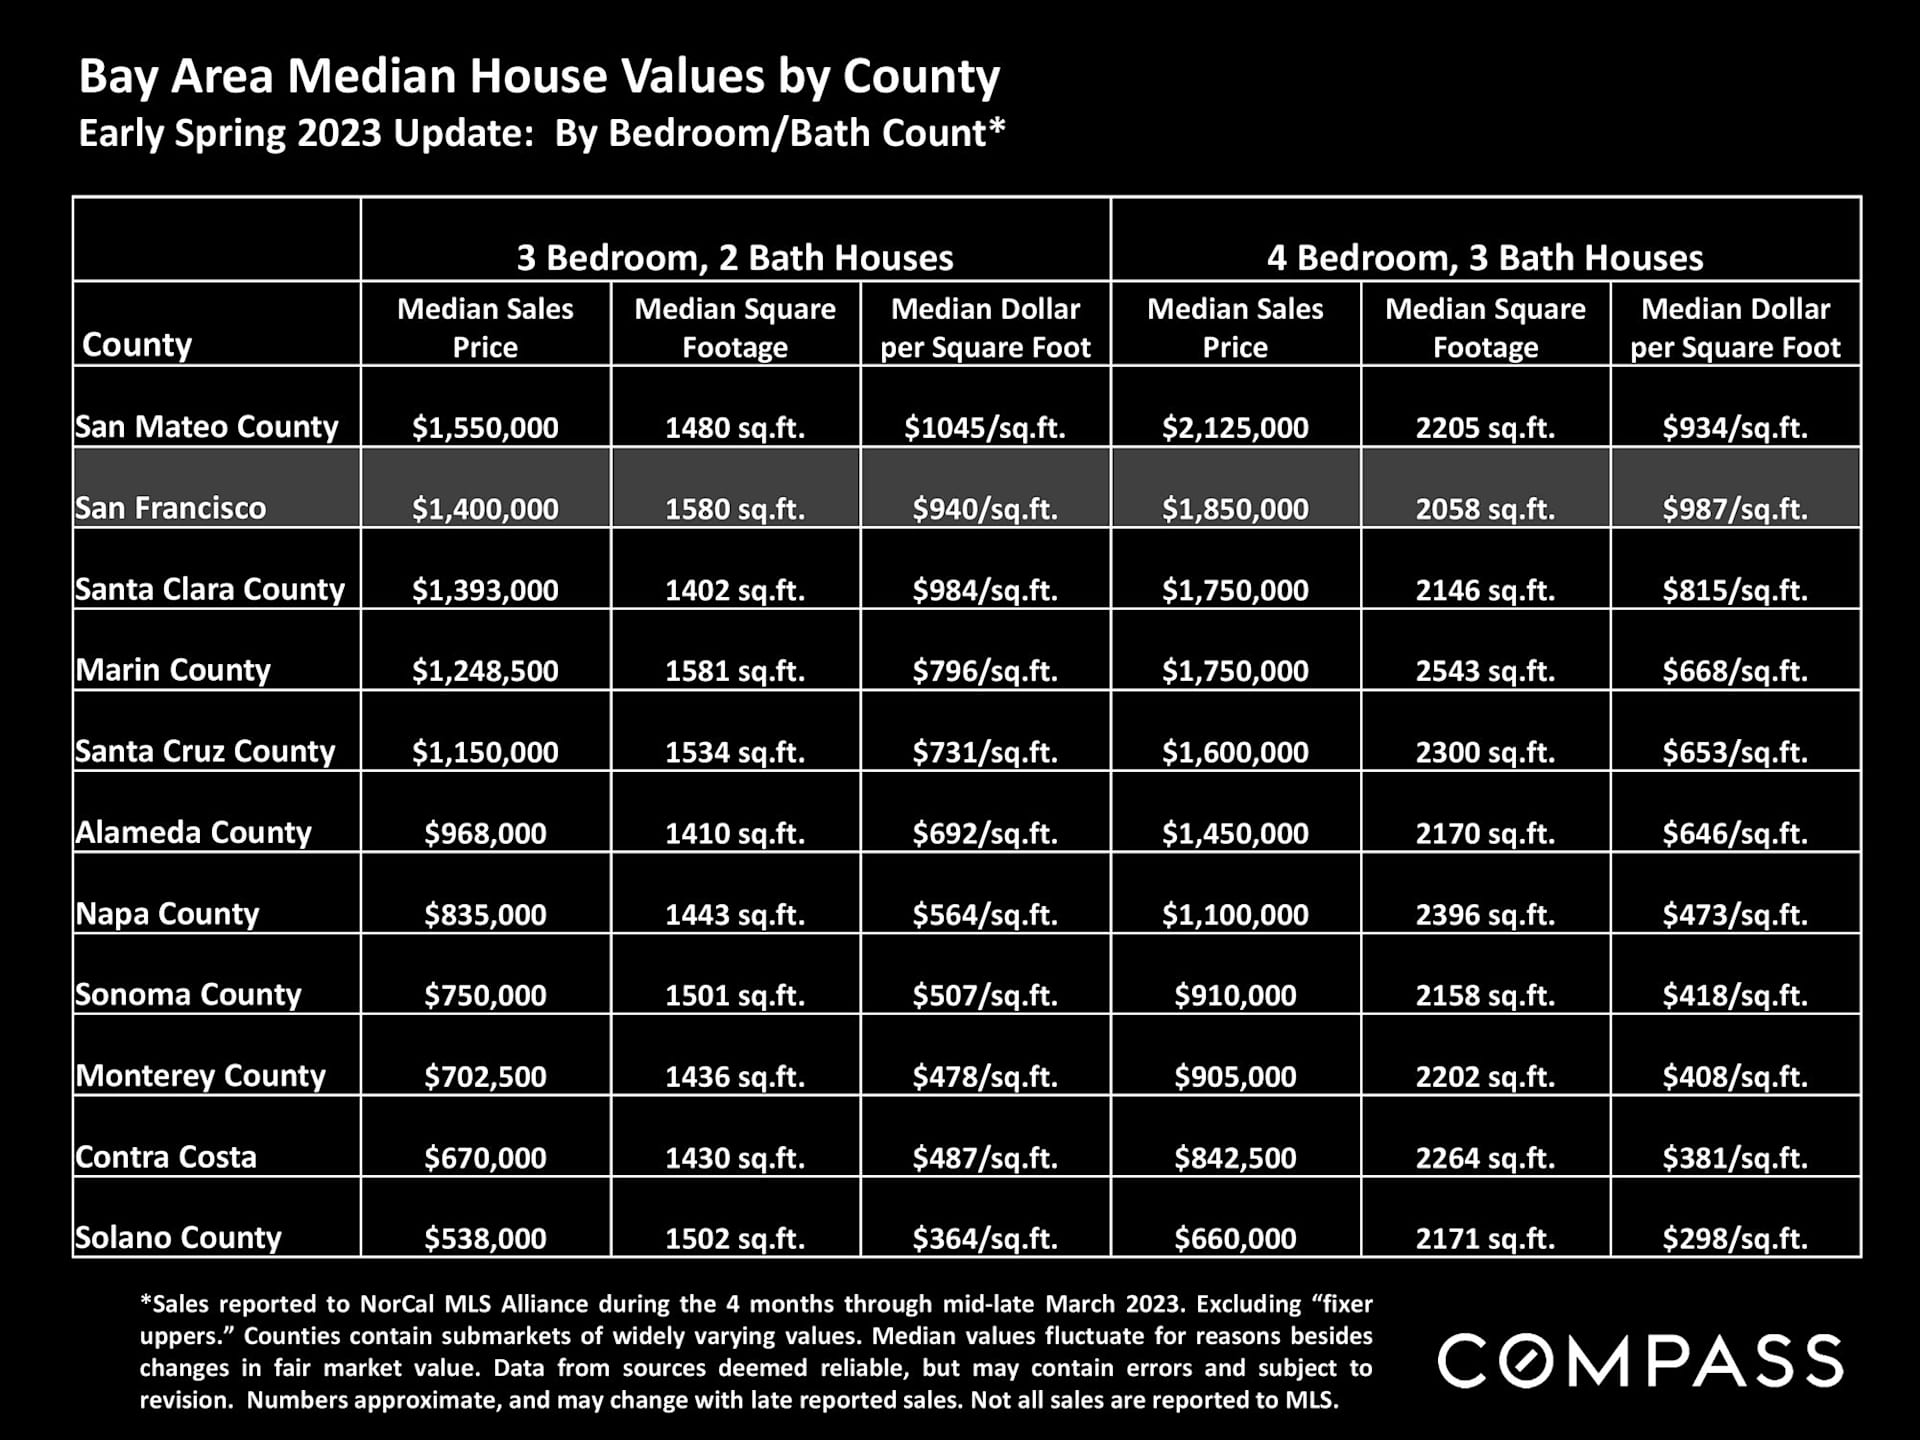
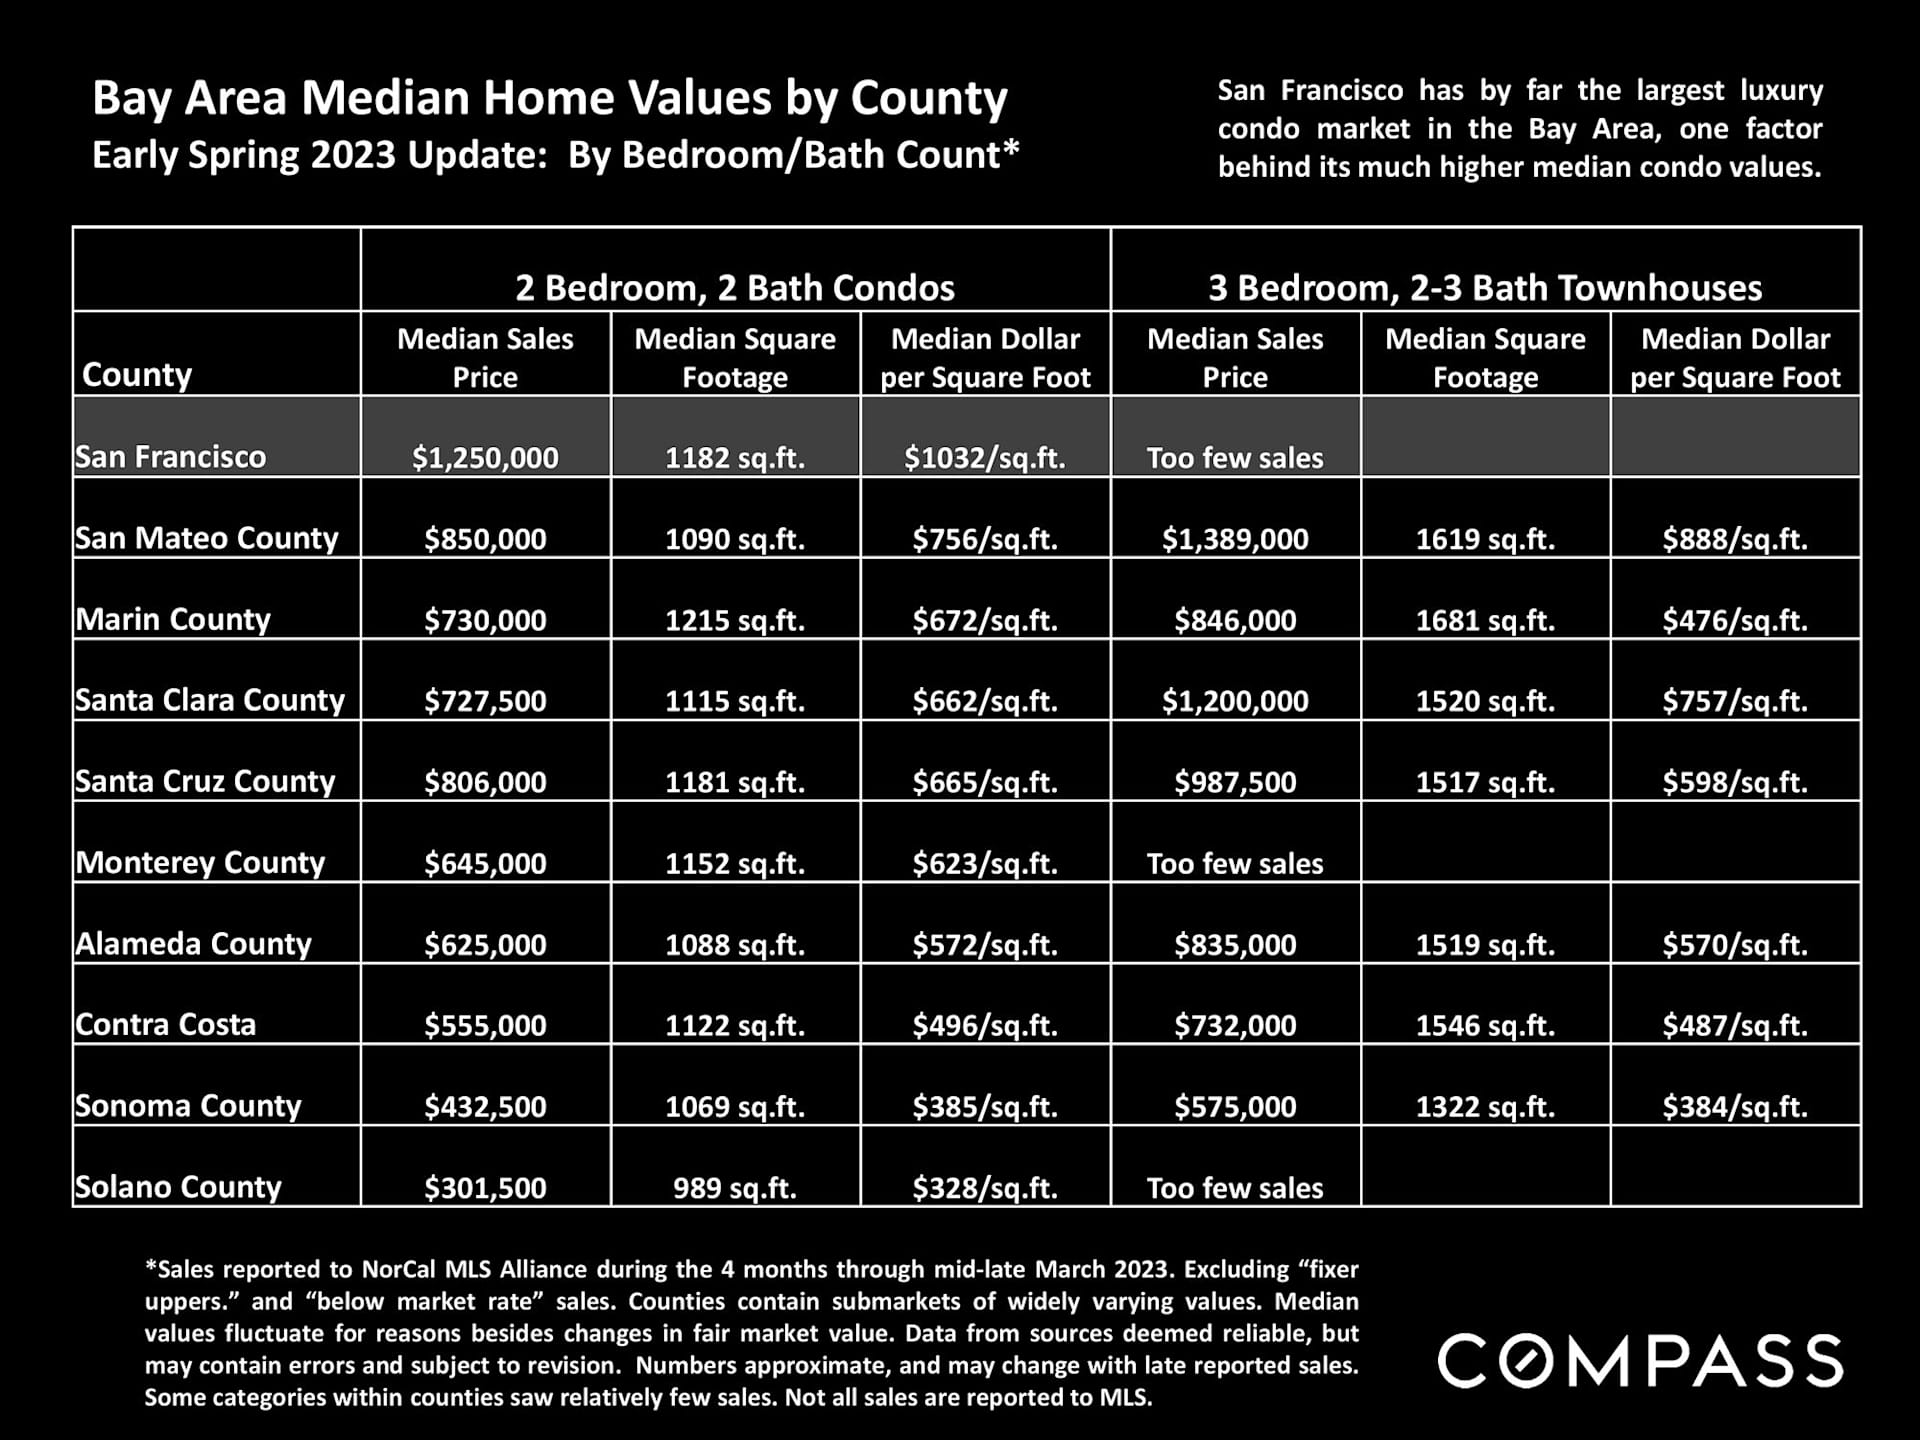
Infographic compares Bay Area home values across 11 counties, with a satellite map and table of prices and home sizes.

Table comparing early spring 2023 large-home values and sales across Bay Area counties, with San Francisco highlighted.

Table comparing early spring 2023 median home prices and square footage by Bay Area county and house size.

Bay Area county home-value table comparing median prices, square footage, and price per square foot for condos and townhouses.

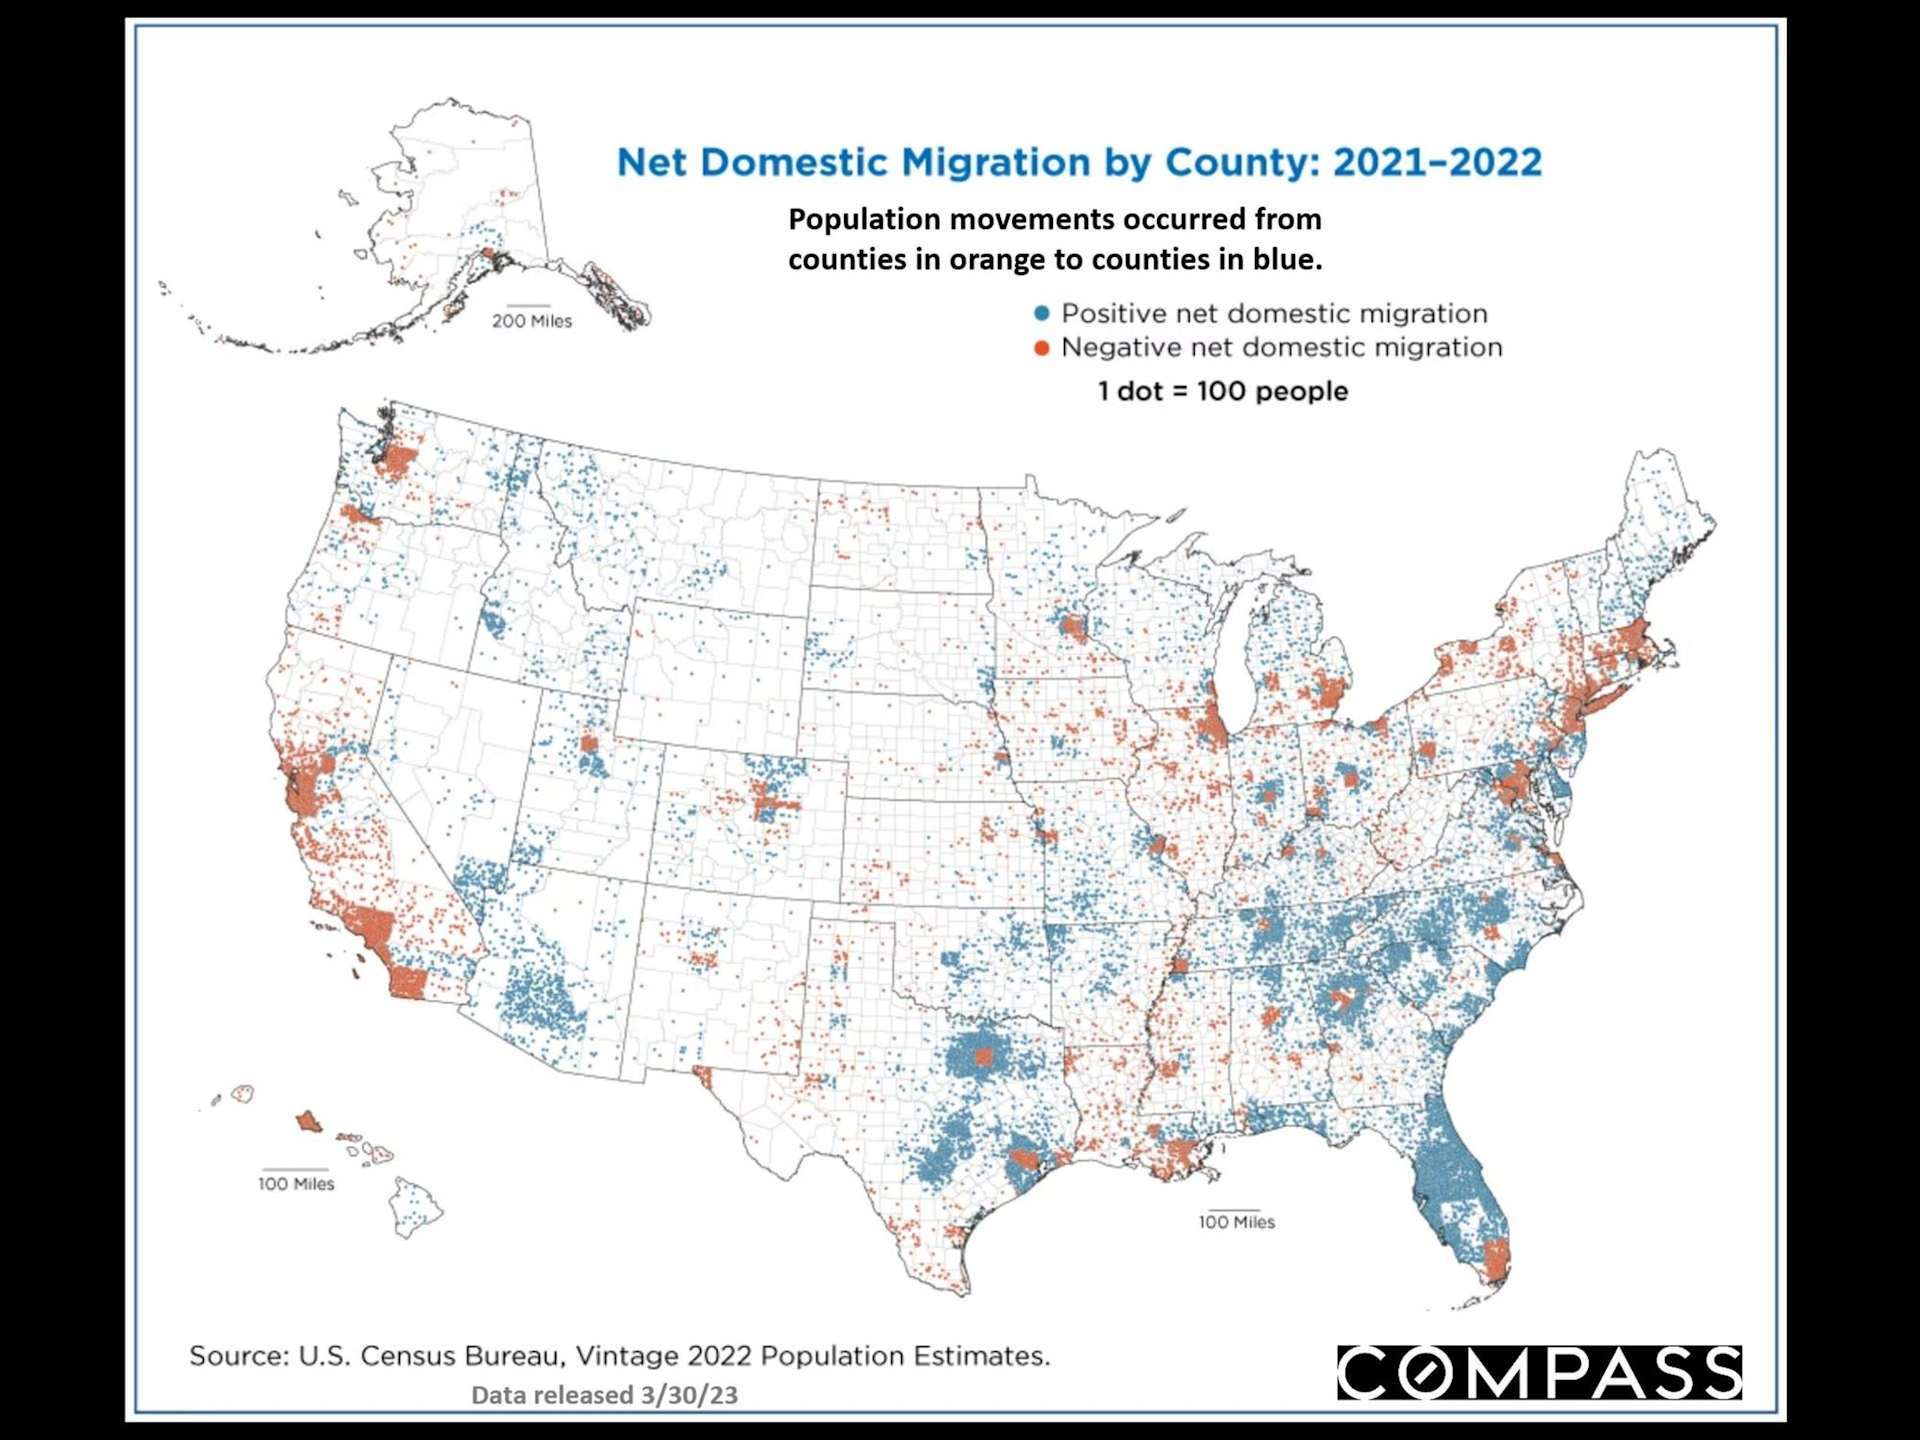
Map of U.S. county migration in 2021–2022, with blue dots for gains and orange dots for losses.

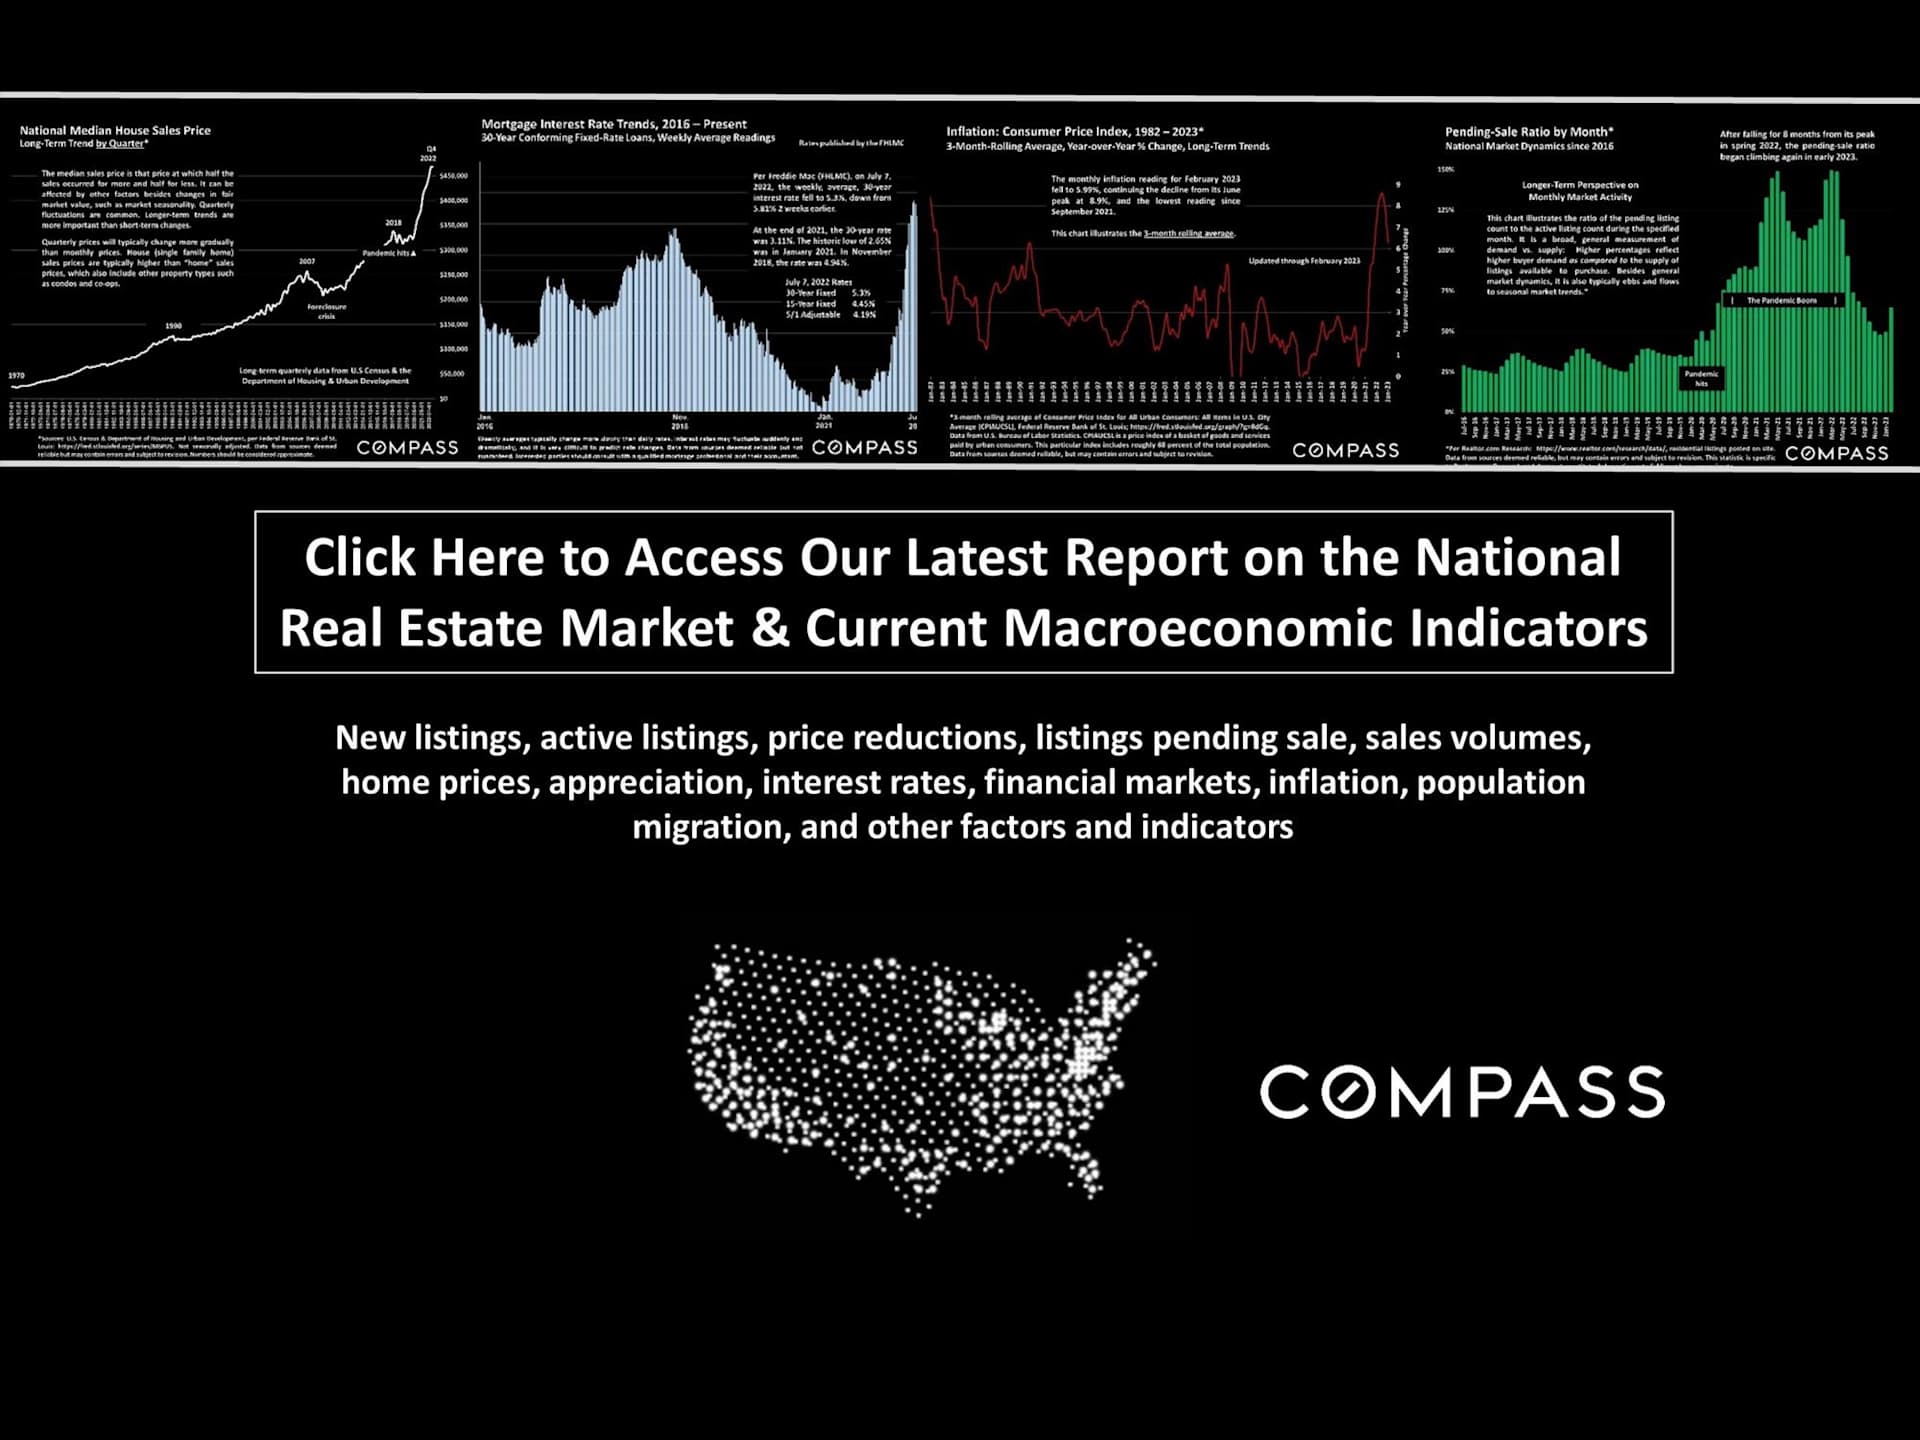
Compass infographic with charts on national home prices, mortgage rates, inflation, and pending-sale ratios.

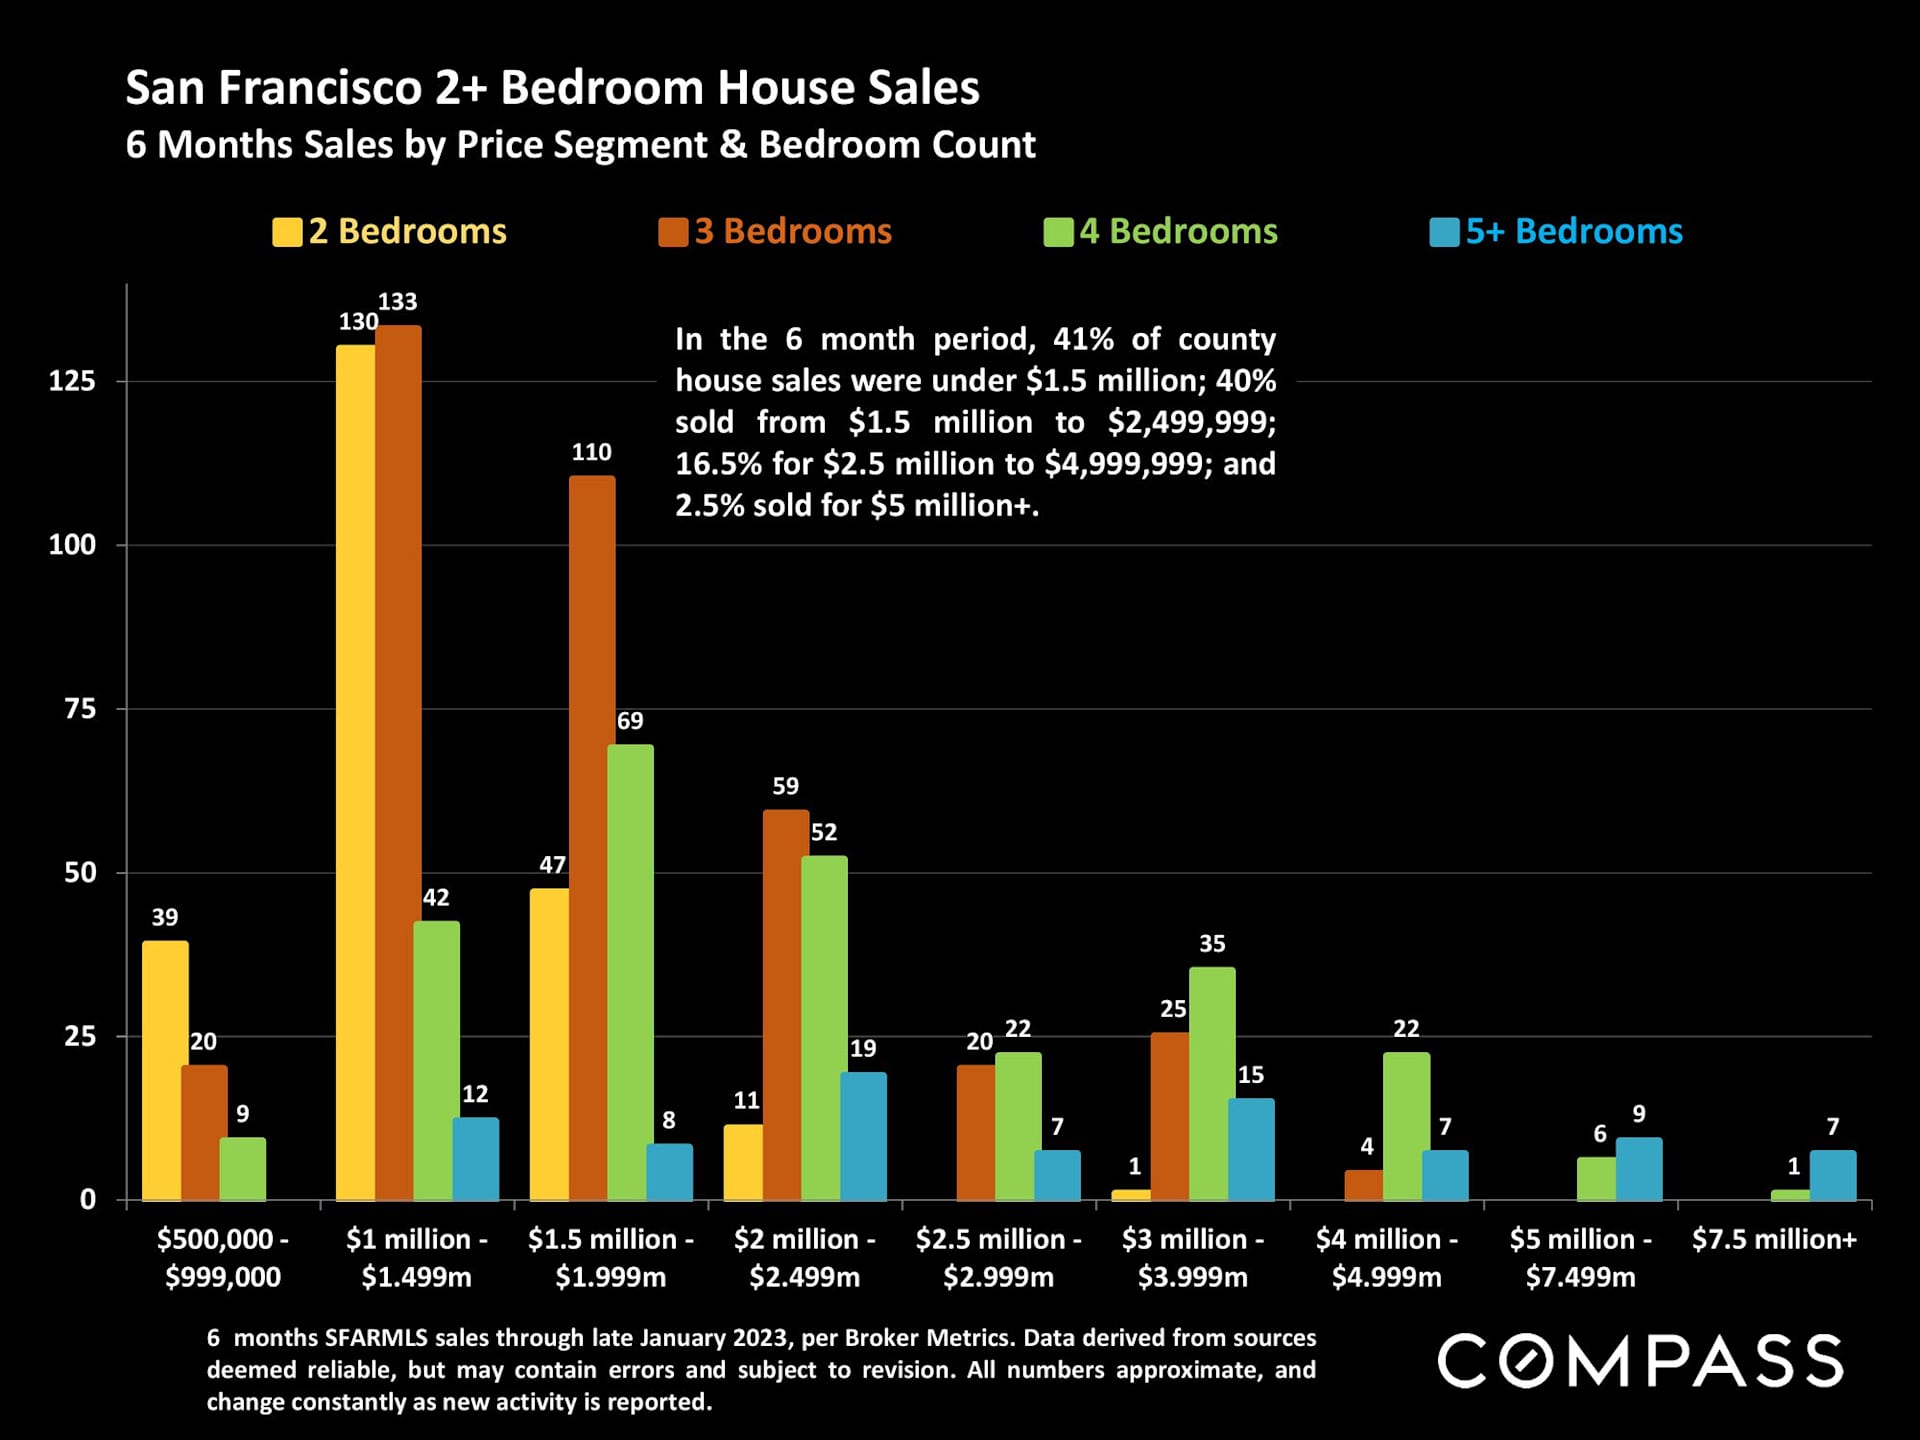
Chart comparing six months of San Francisco house sales by price range and bedroom count.

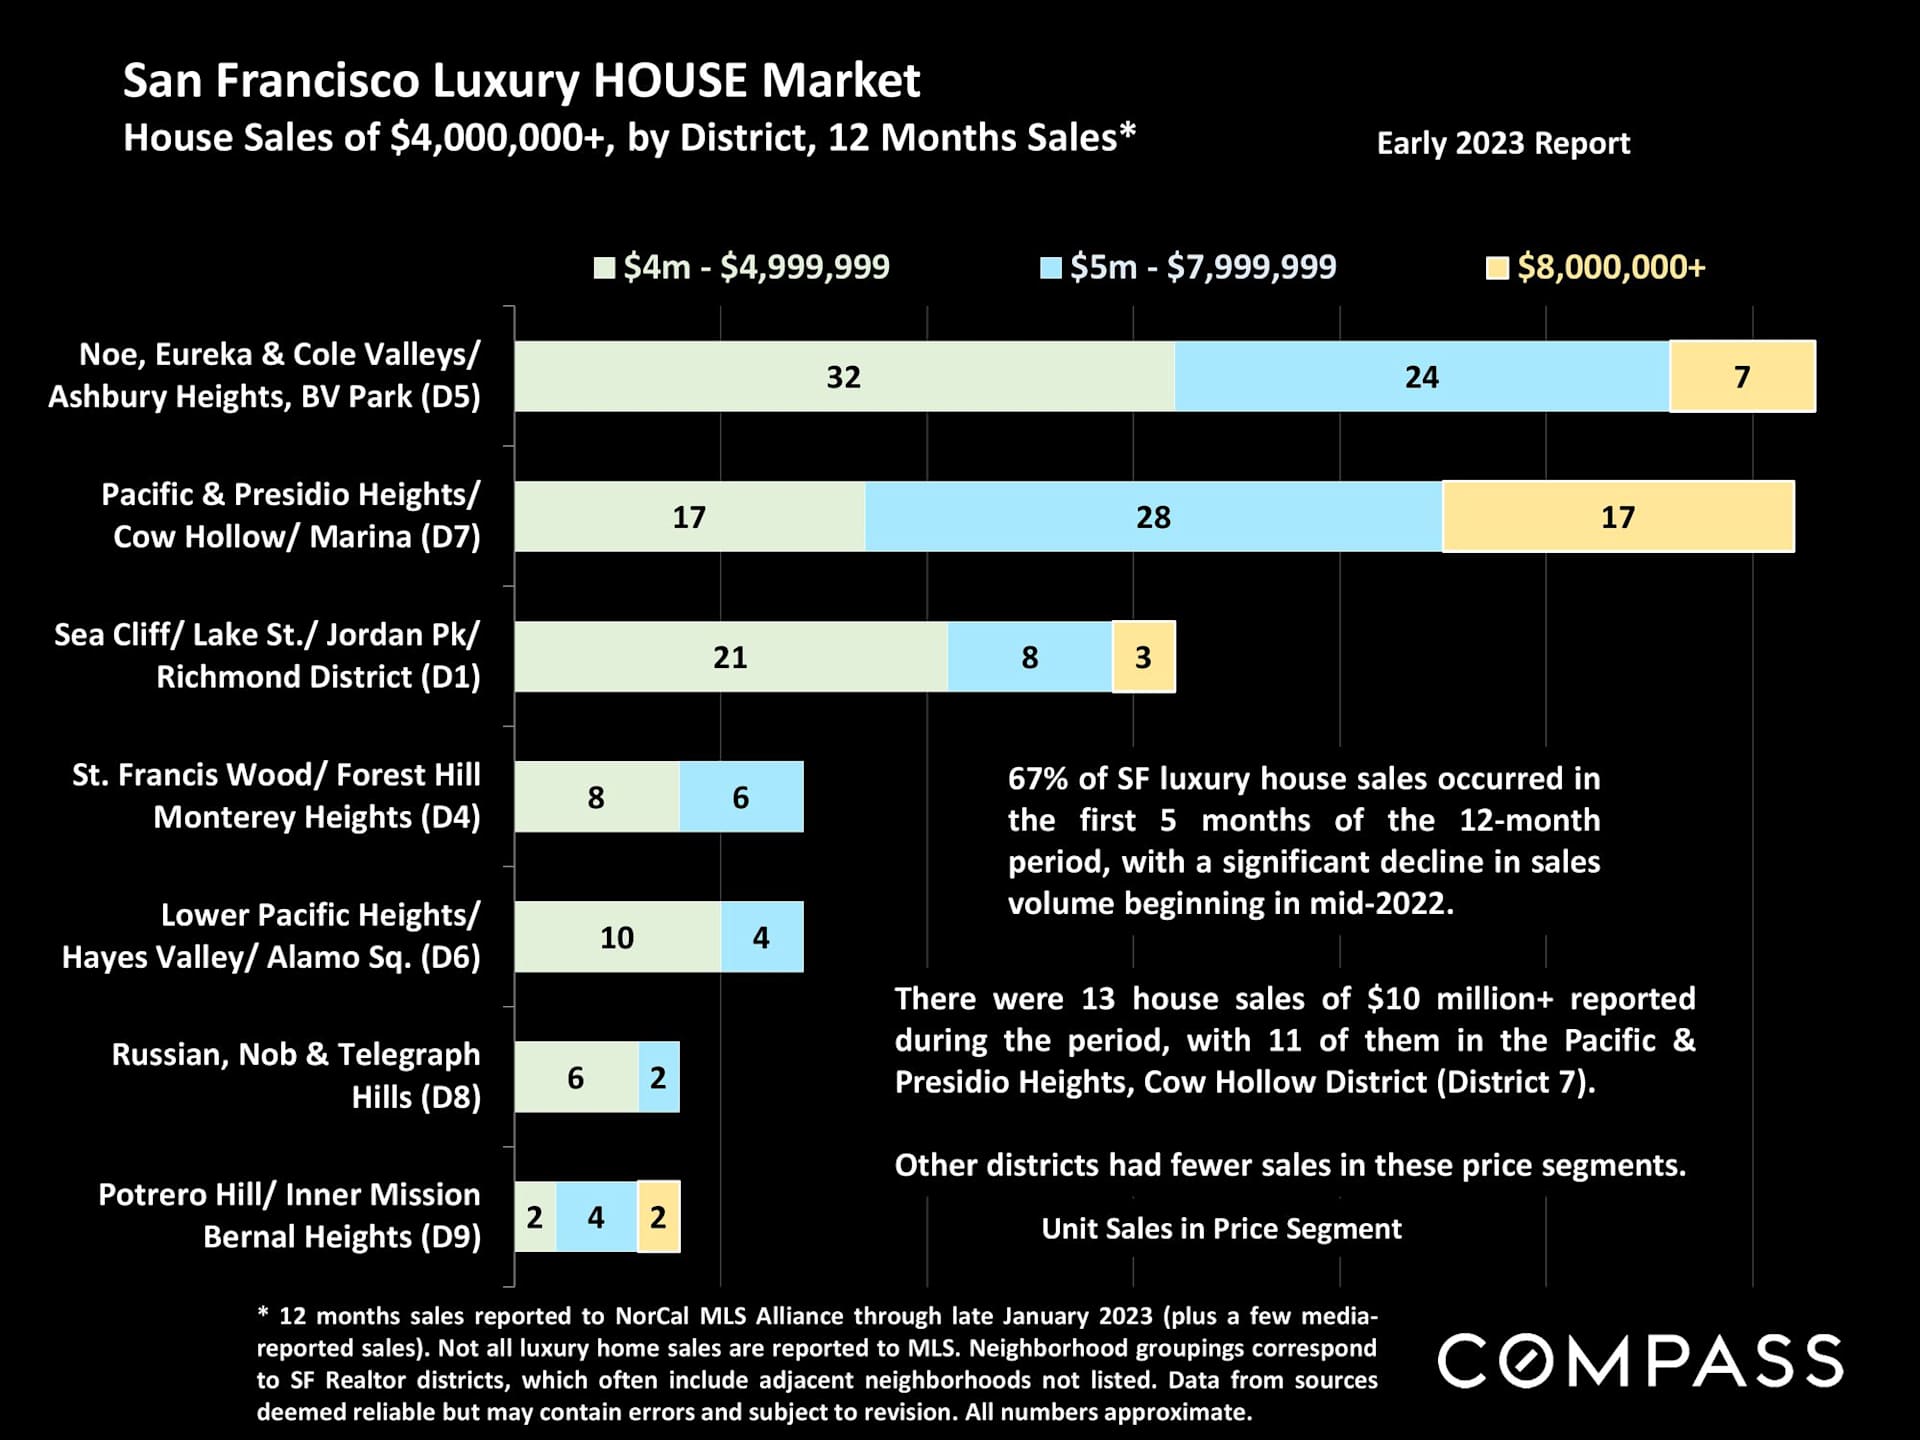
Chart of San Francisco luxury home sales by district and price range, highlighting District 7’s high-end sales.

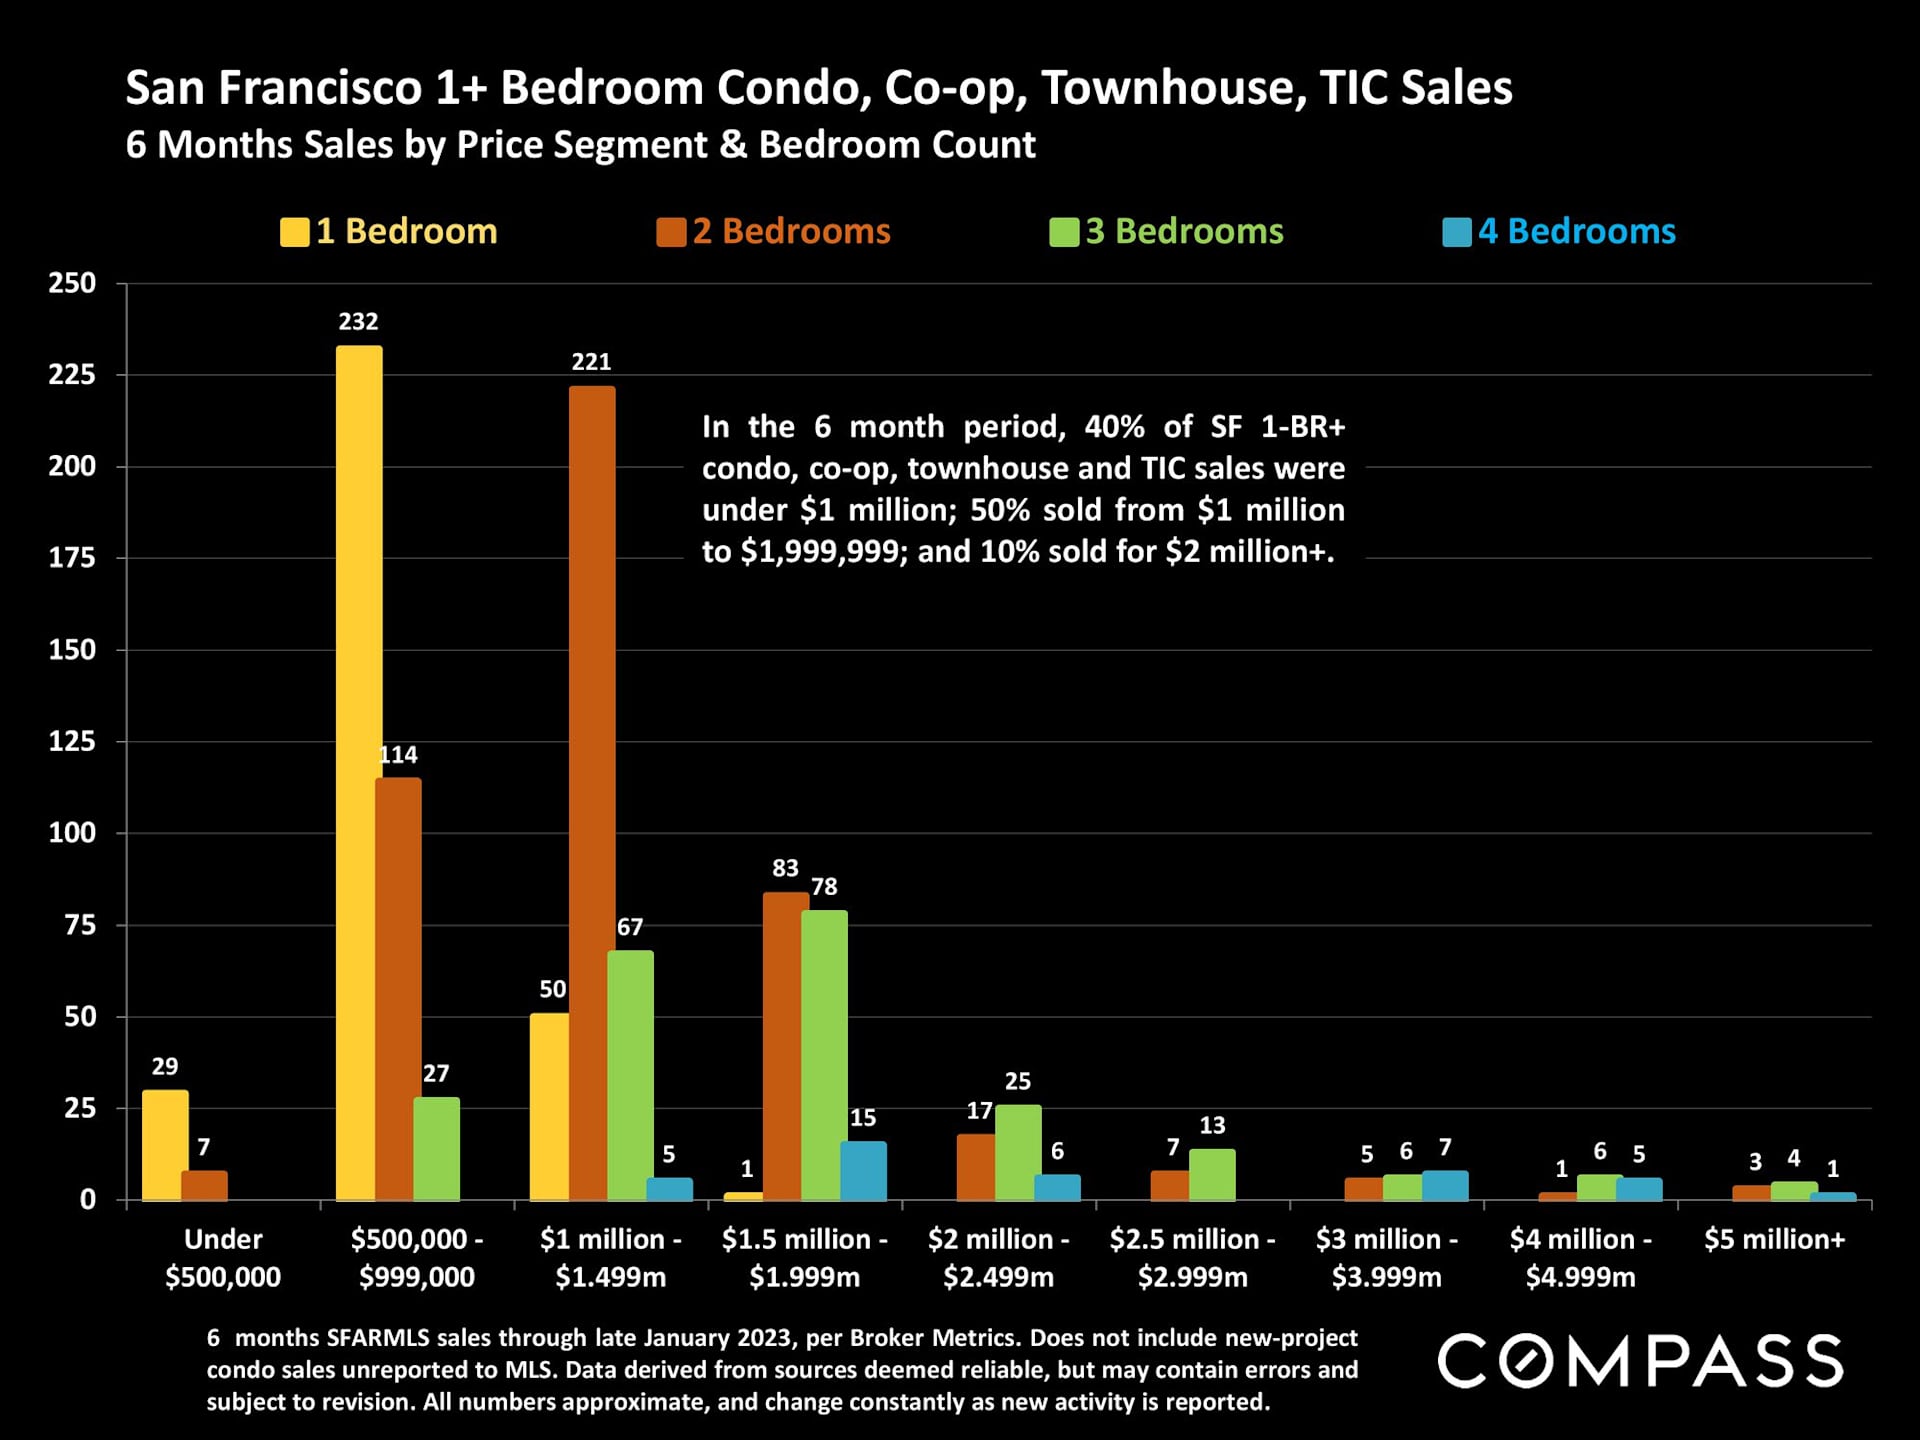
Bar chart of San Francisco home sales by price range and bedroom count, with most sales under $2 million.

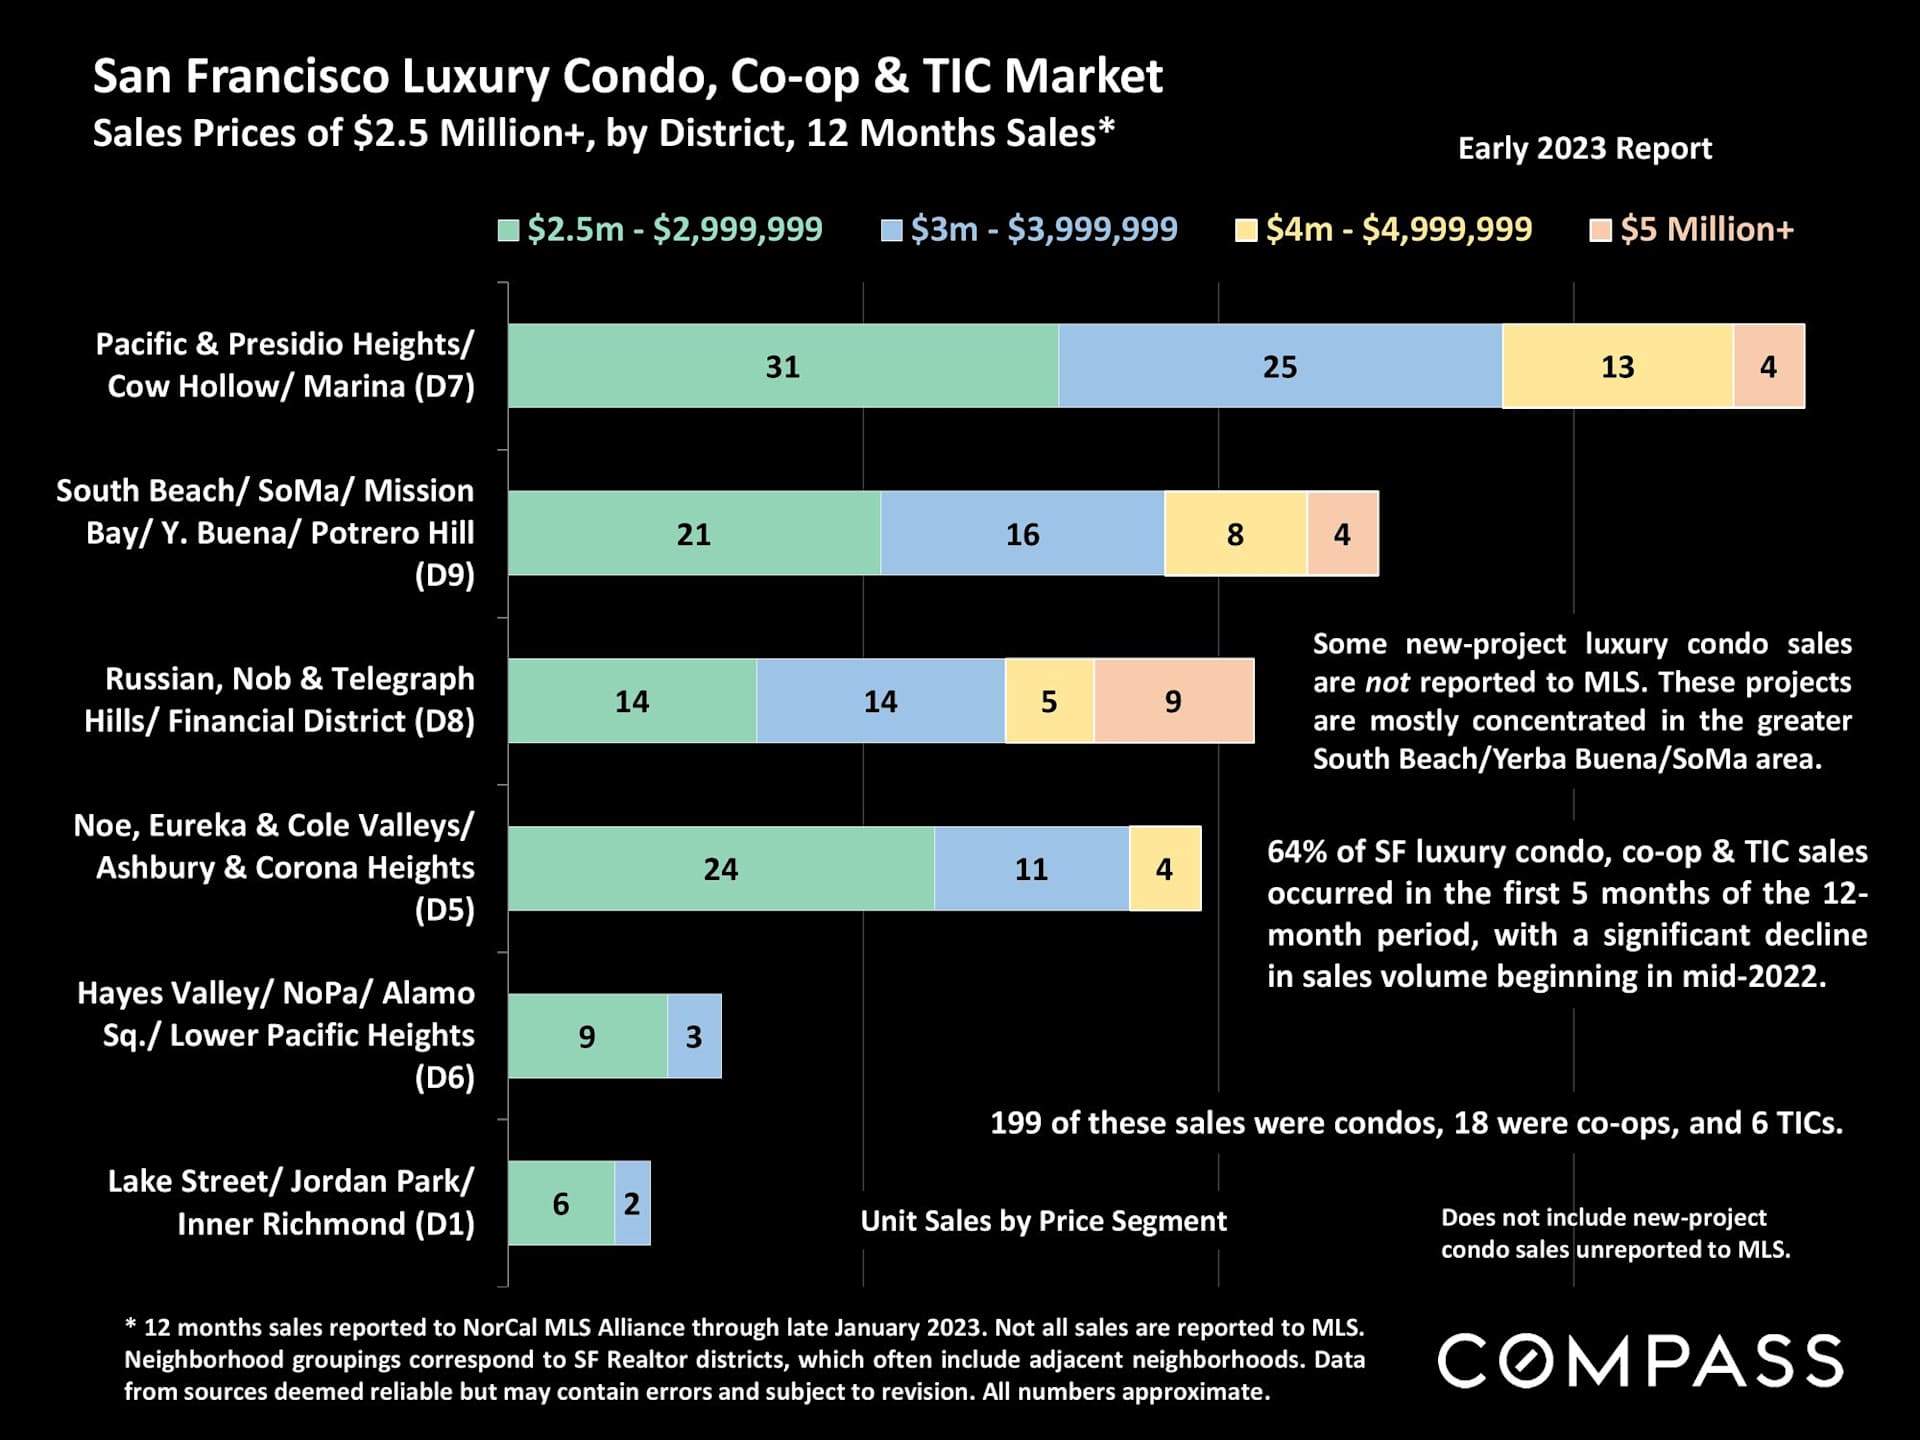
Chart of San Francisco luxury condo, co-op, and TIC sales by district and price segment, with early 2023 market notes.

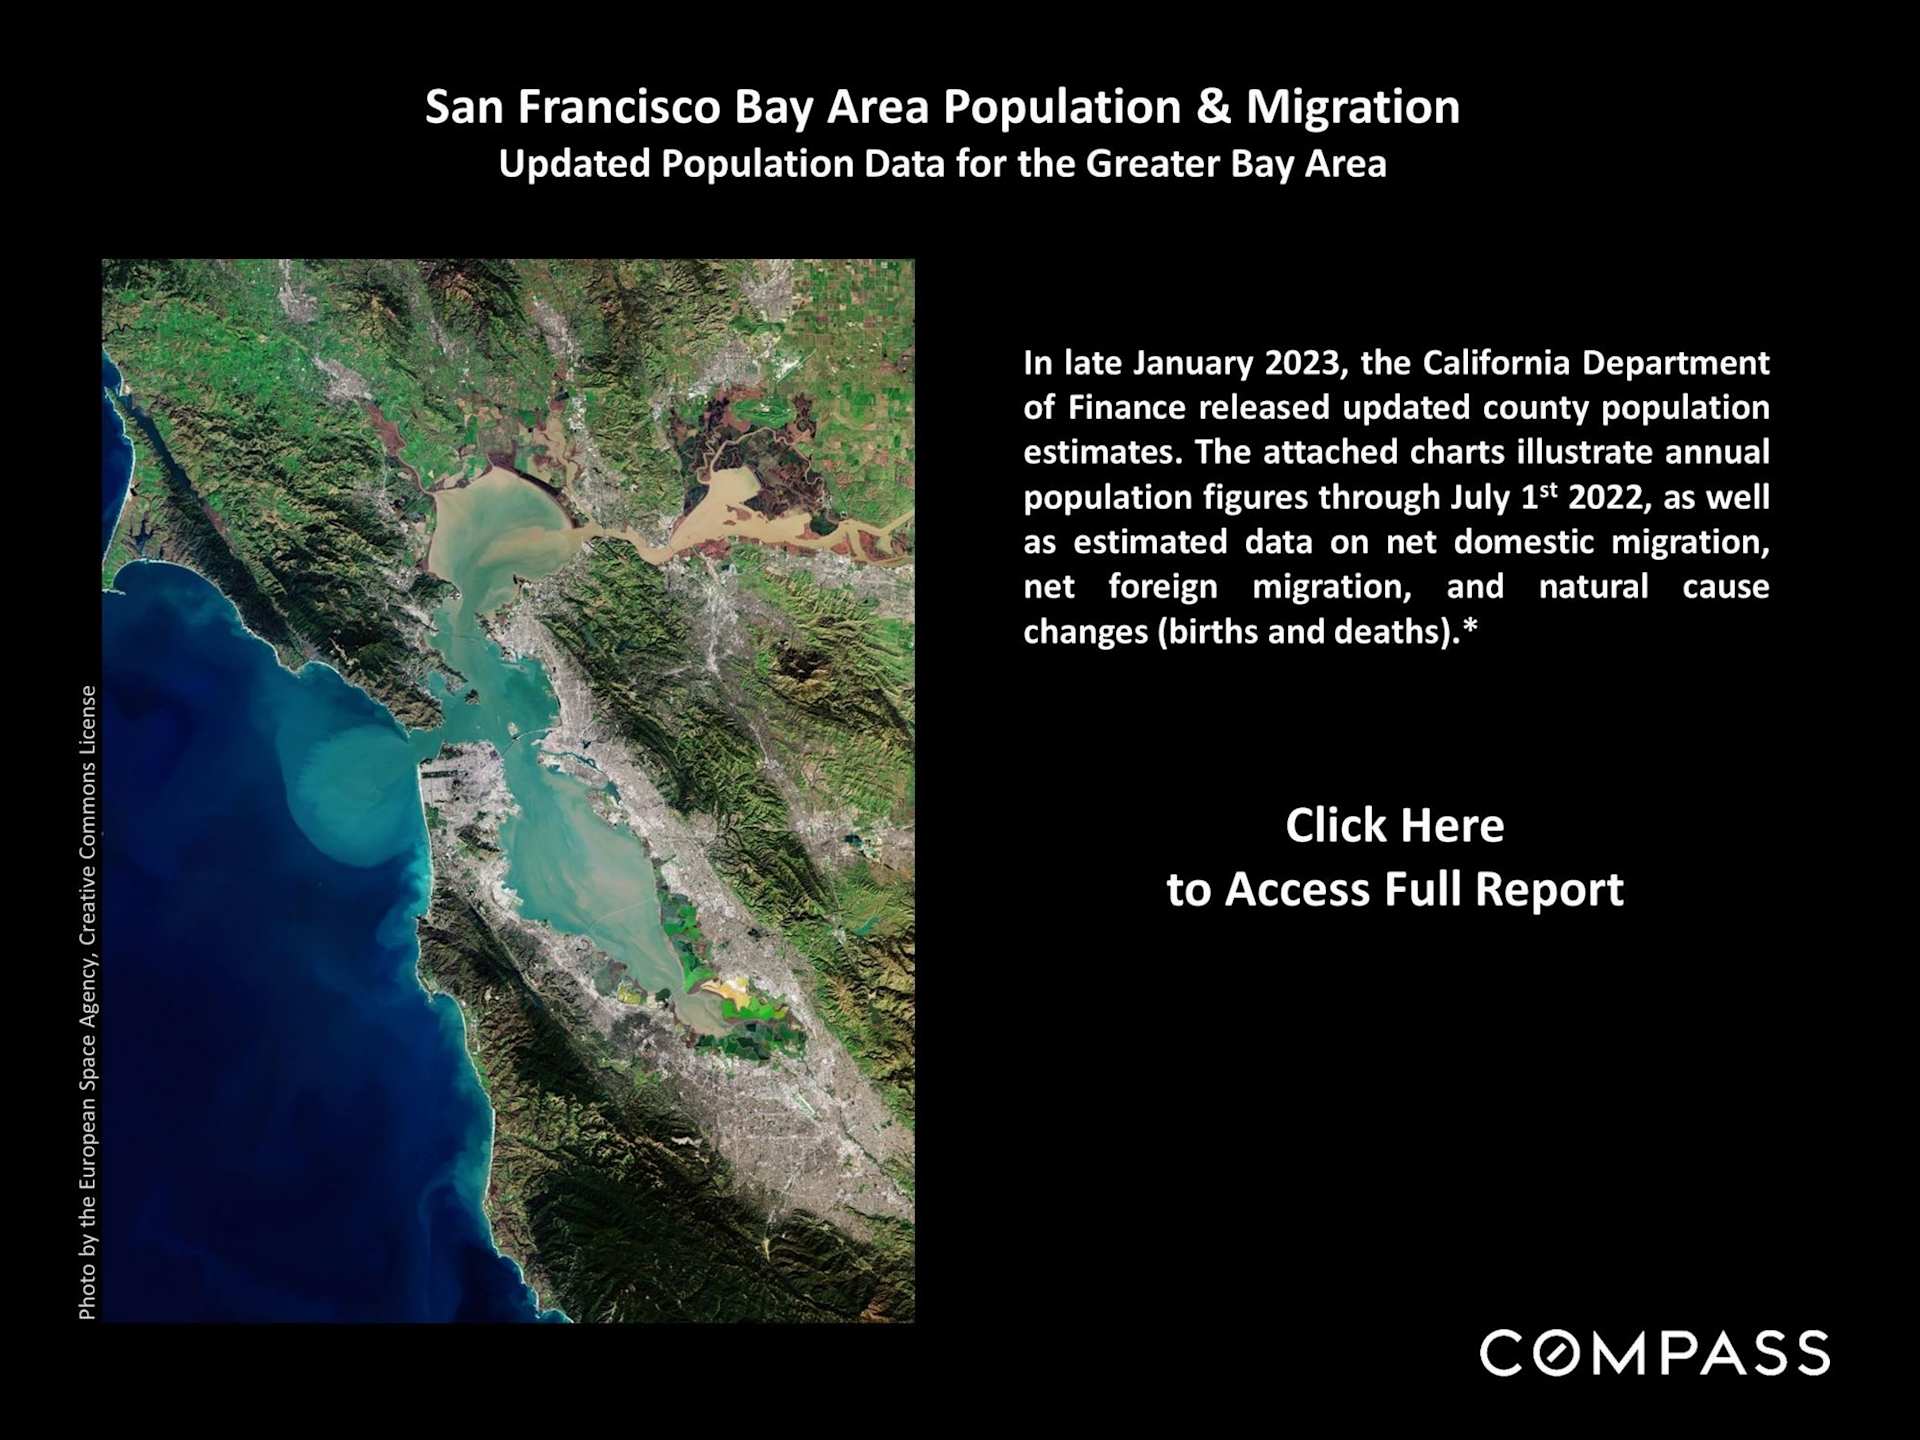
San Francisco Bay Area population and migration report graphic with a satellite map and link to the full report.

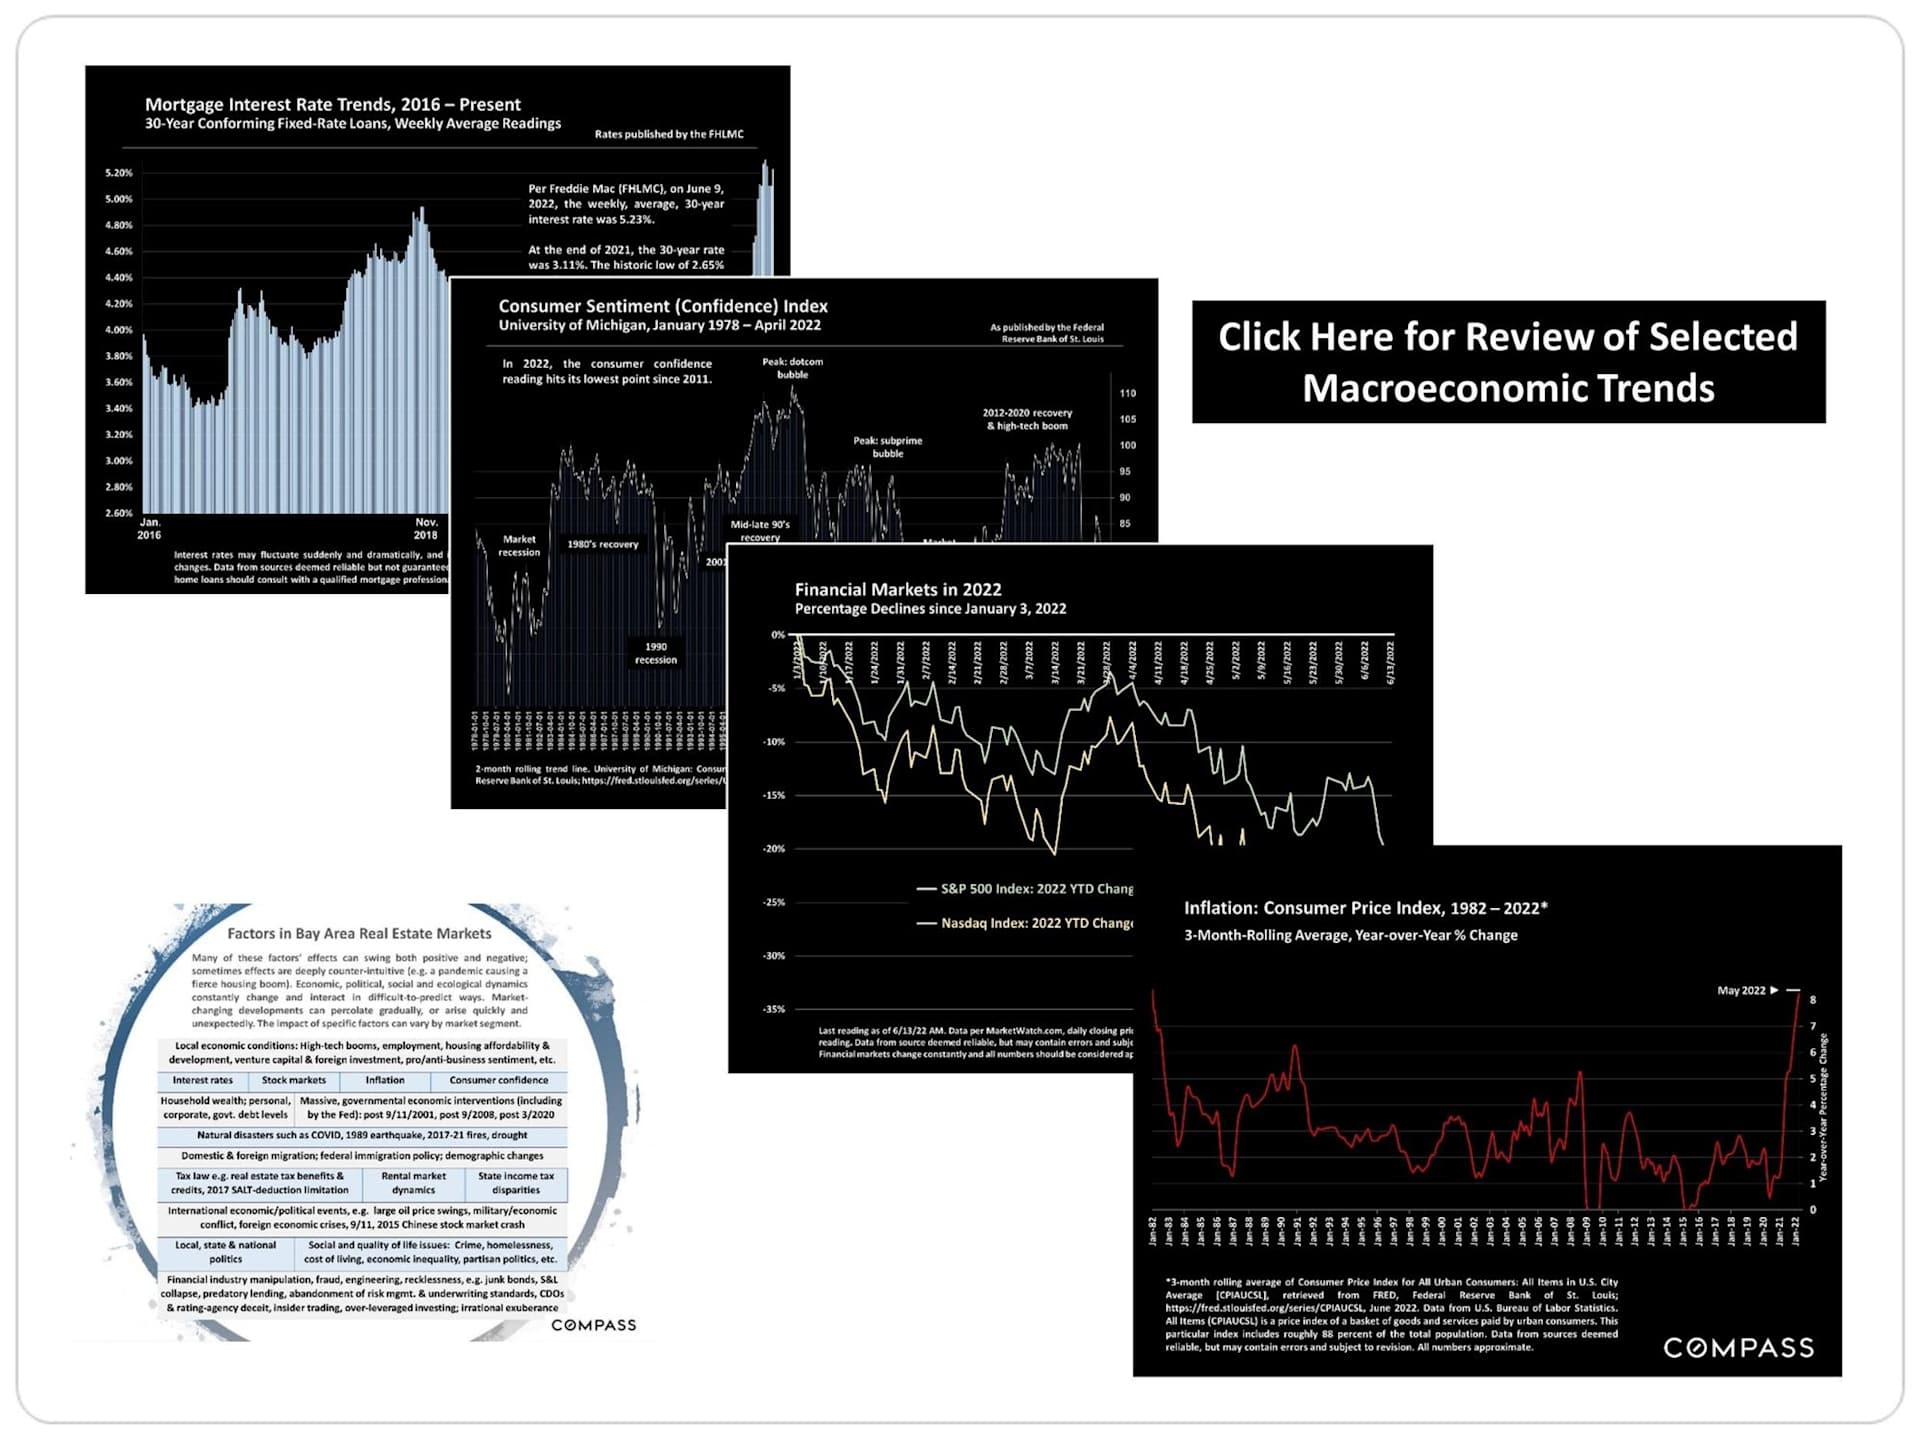
Economic charts on mortgage rates, consumer confidence, financial markets, inflation, and Bay Area real estate factors.

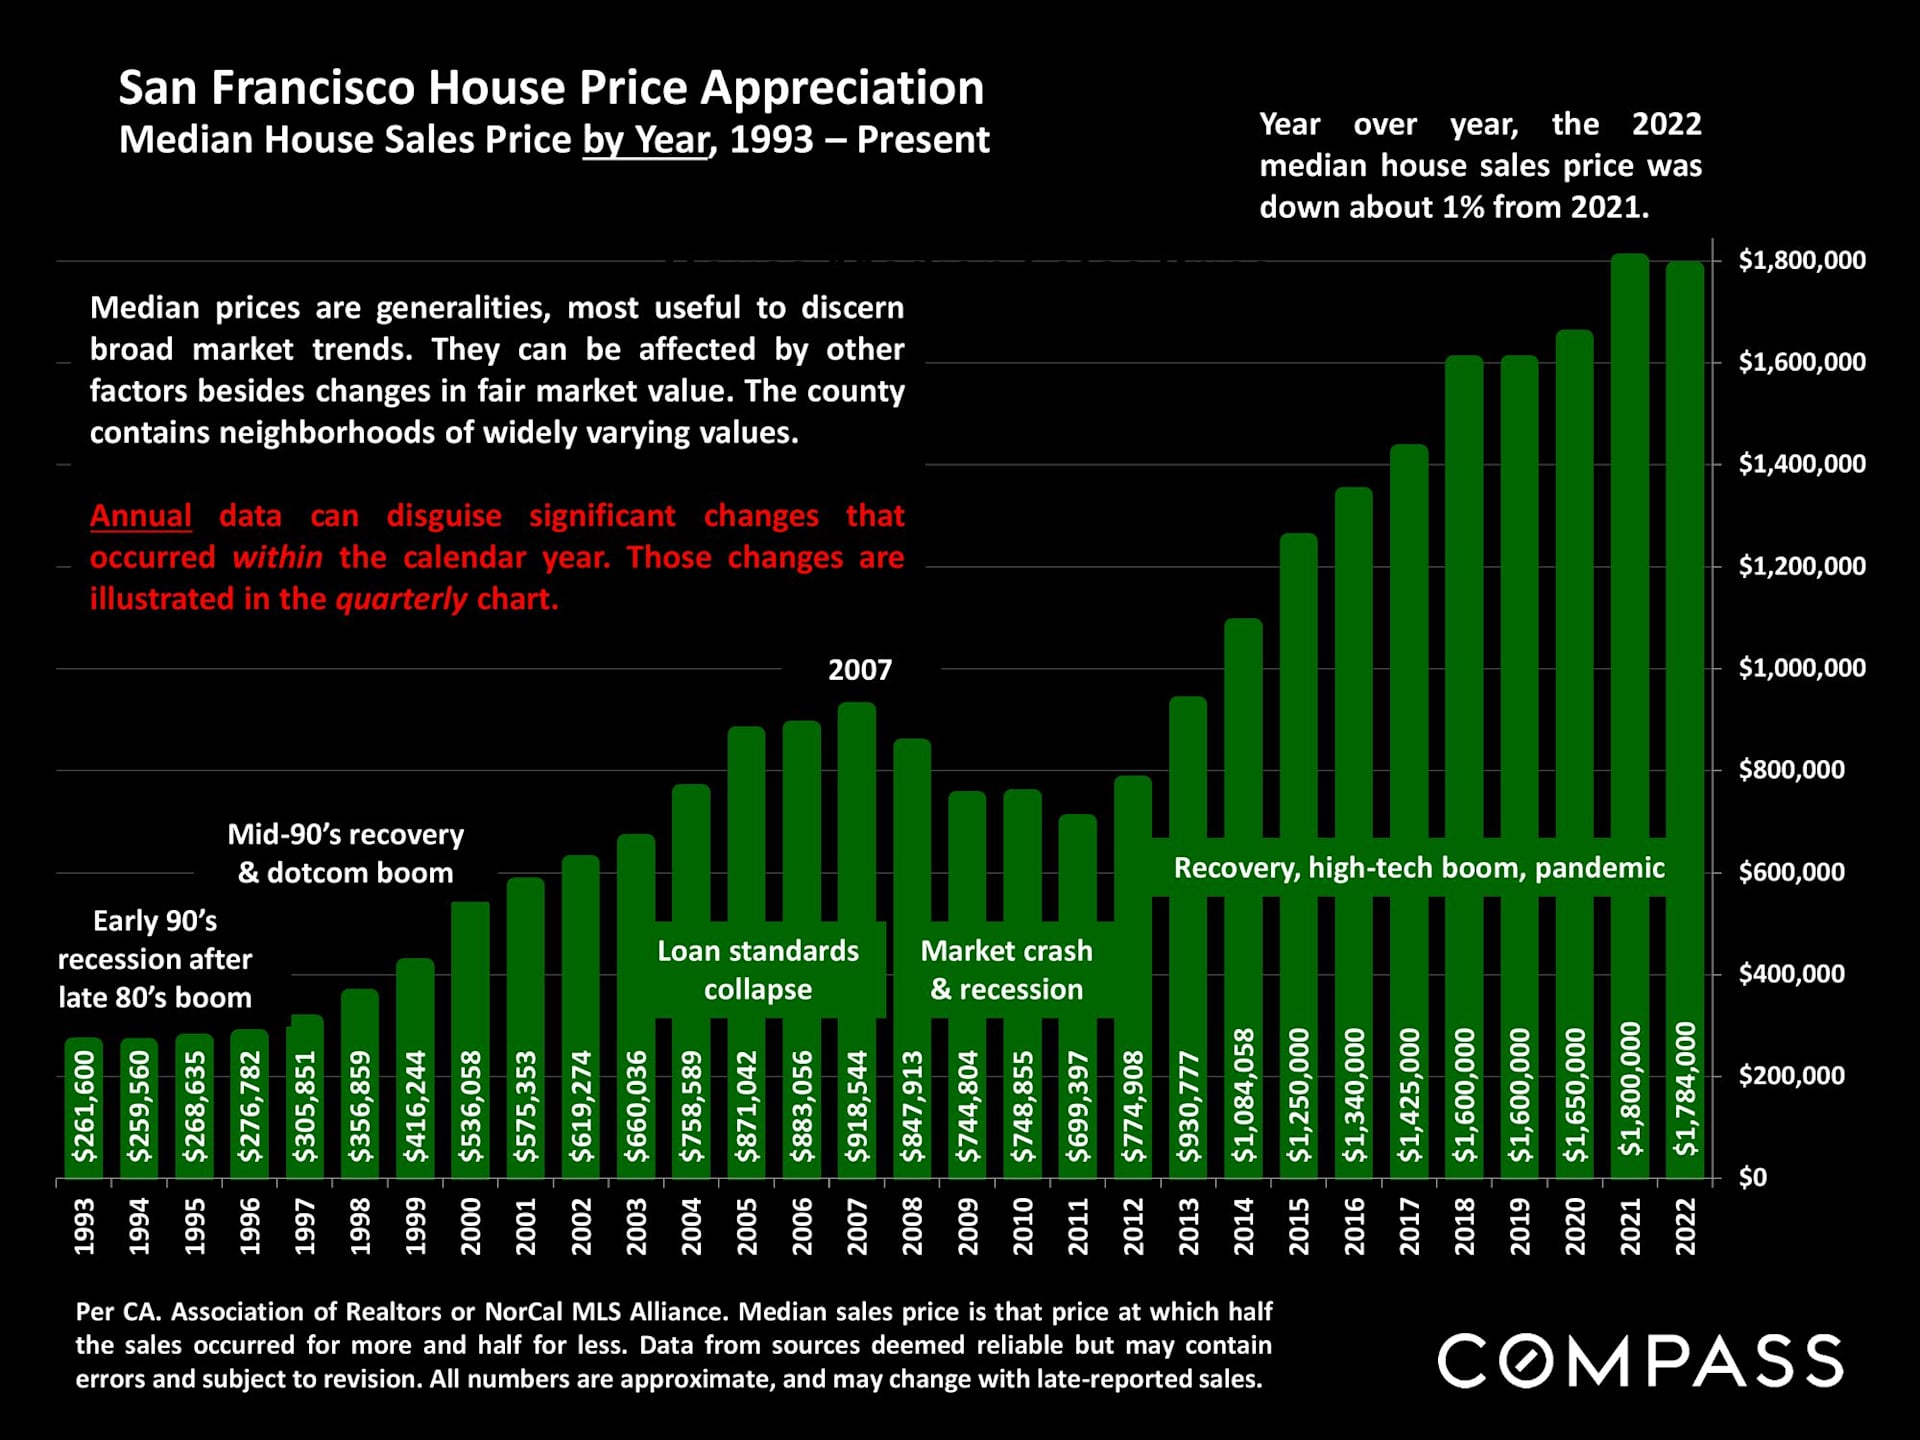
Chart of San Francisco median house sale prices from 1993 through 2022, with green bars and historical annotations.

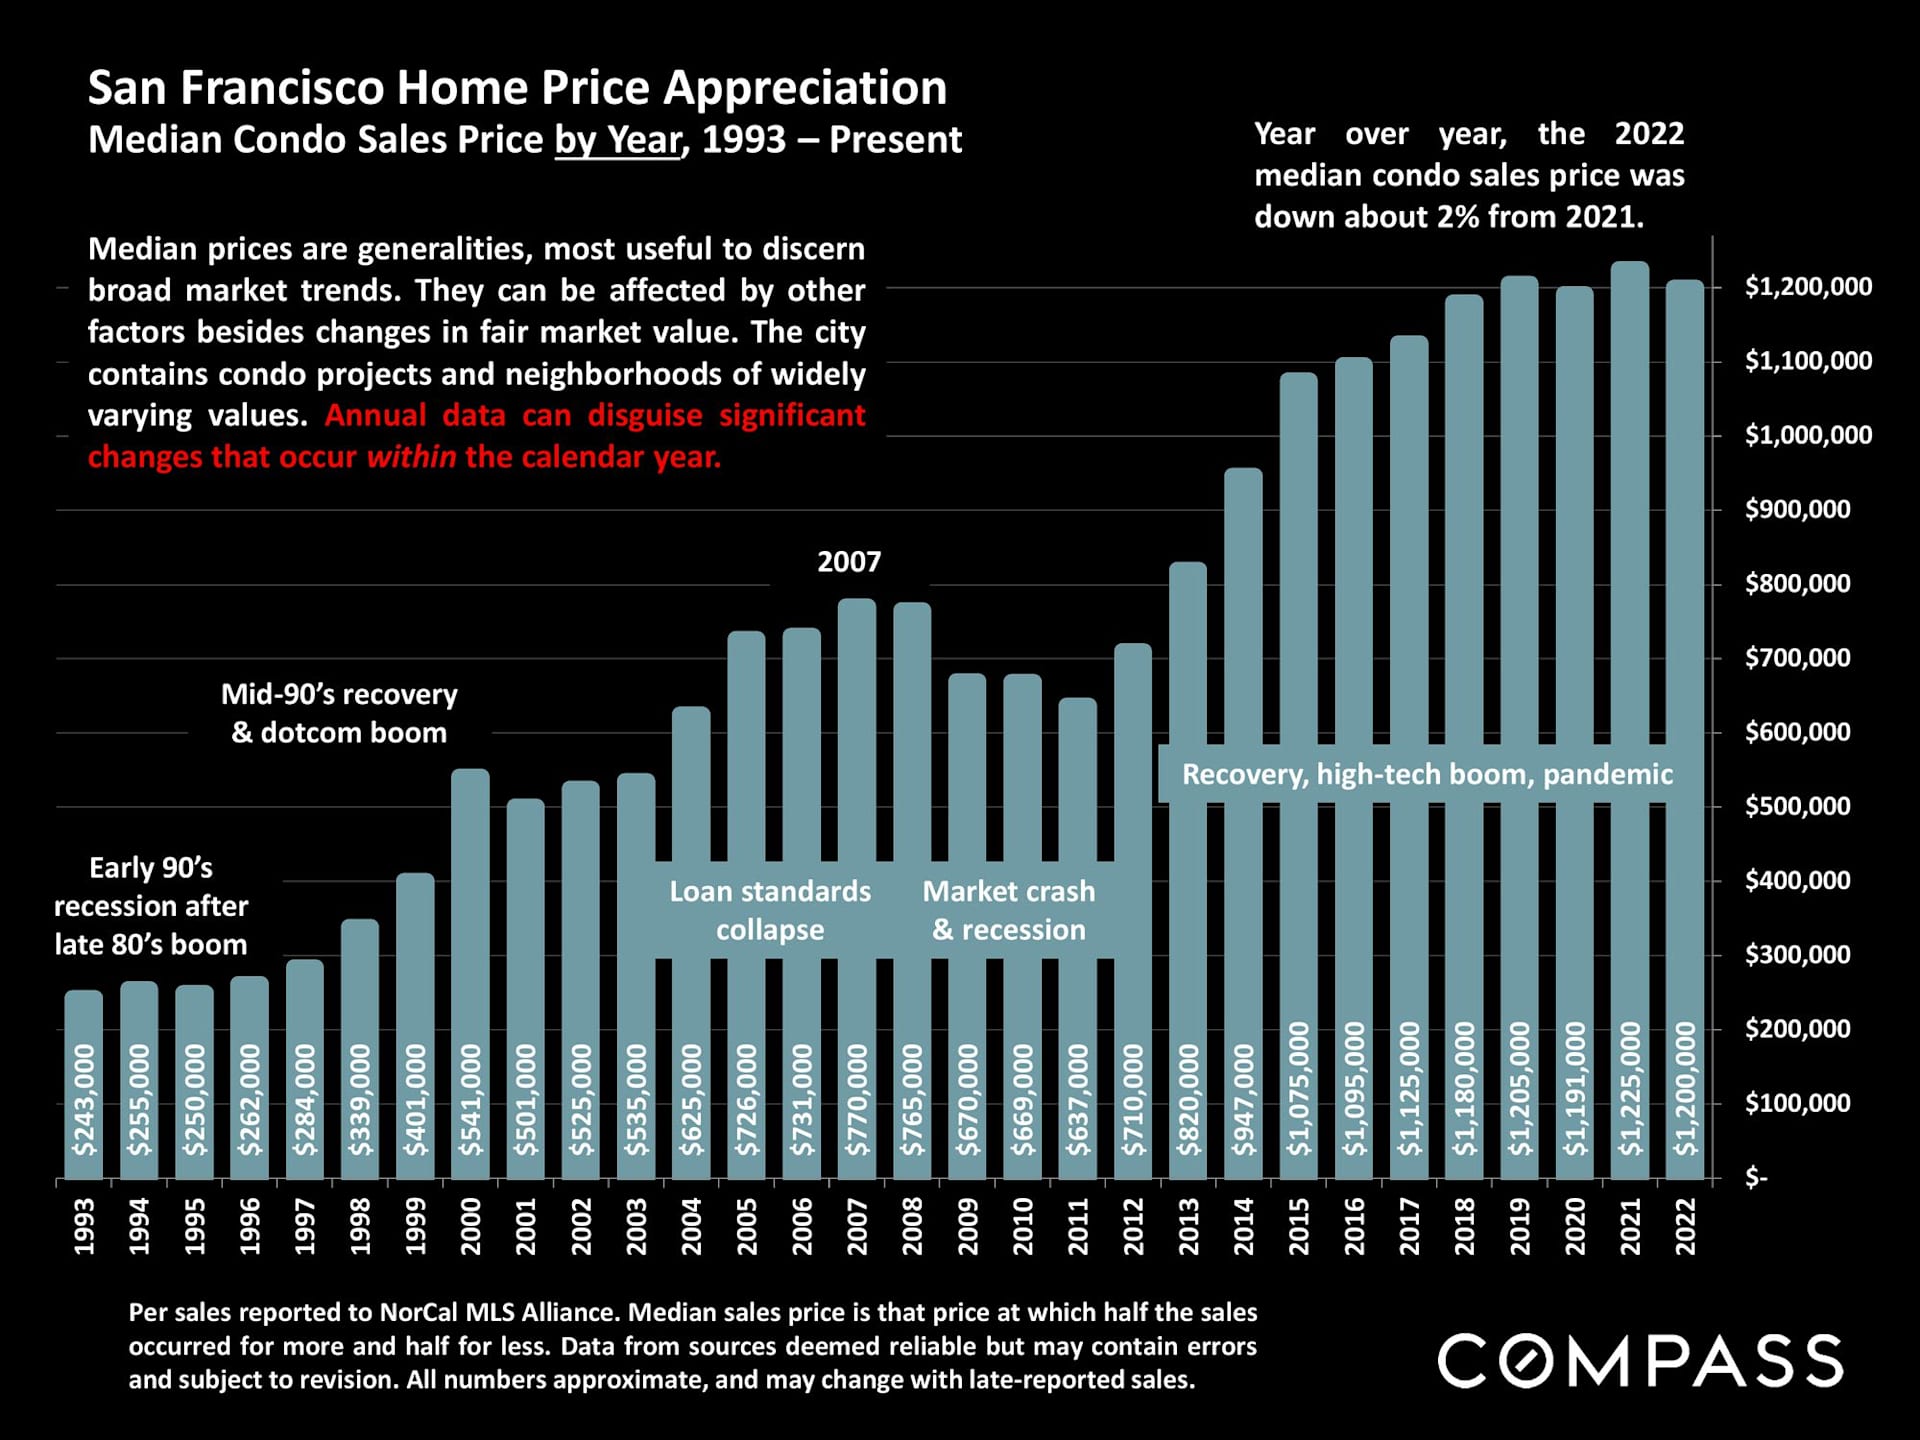
Bar chart of San Francisco median condo prices from 1993 to 2022, rising overall to $1.2 million.

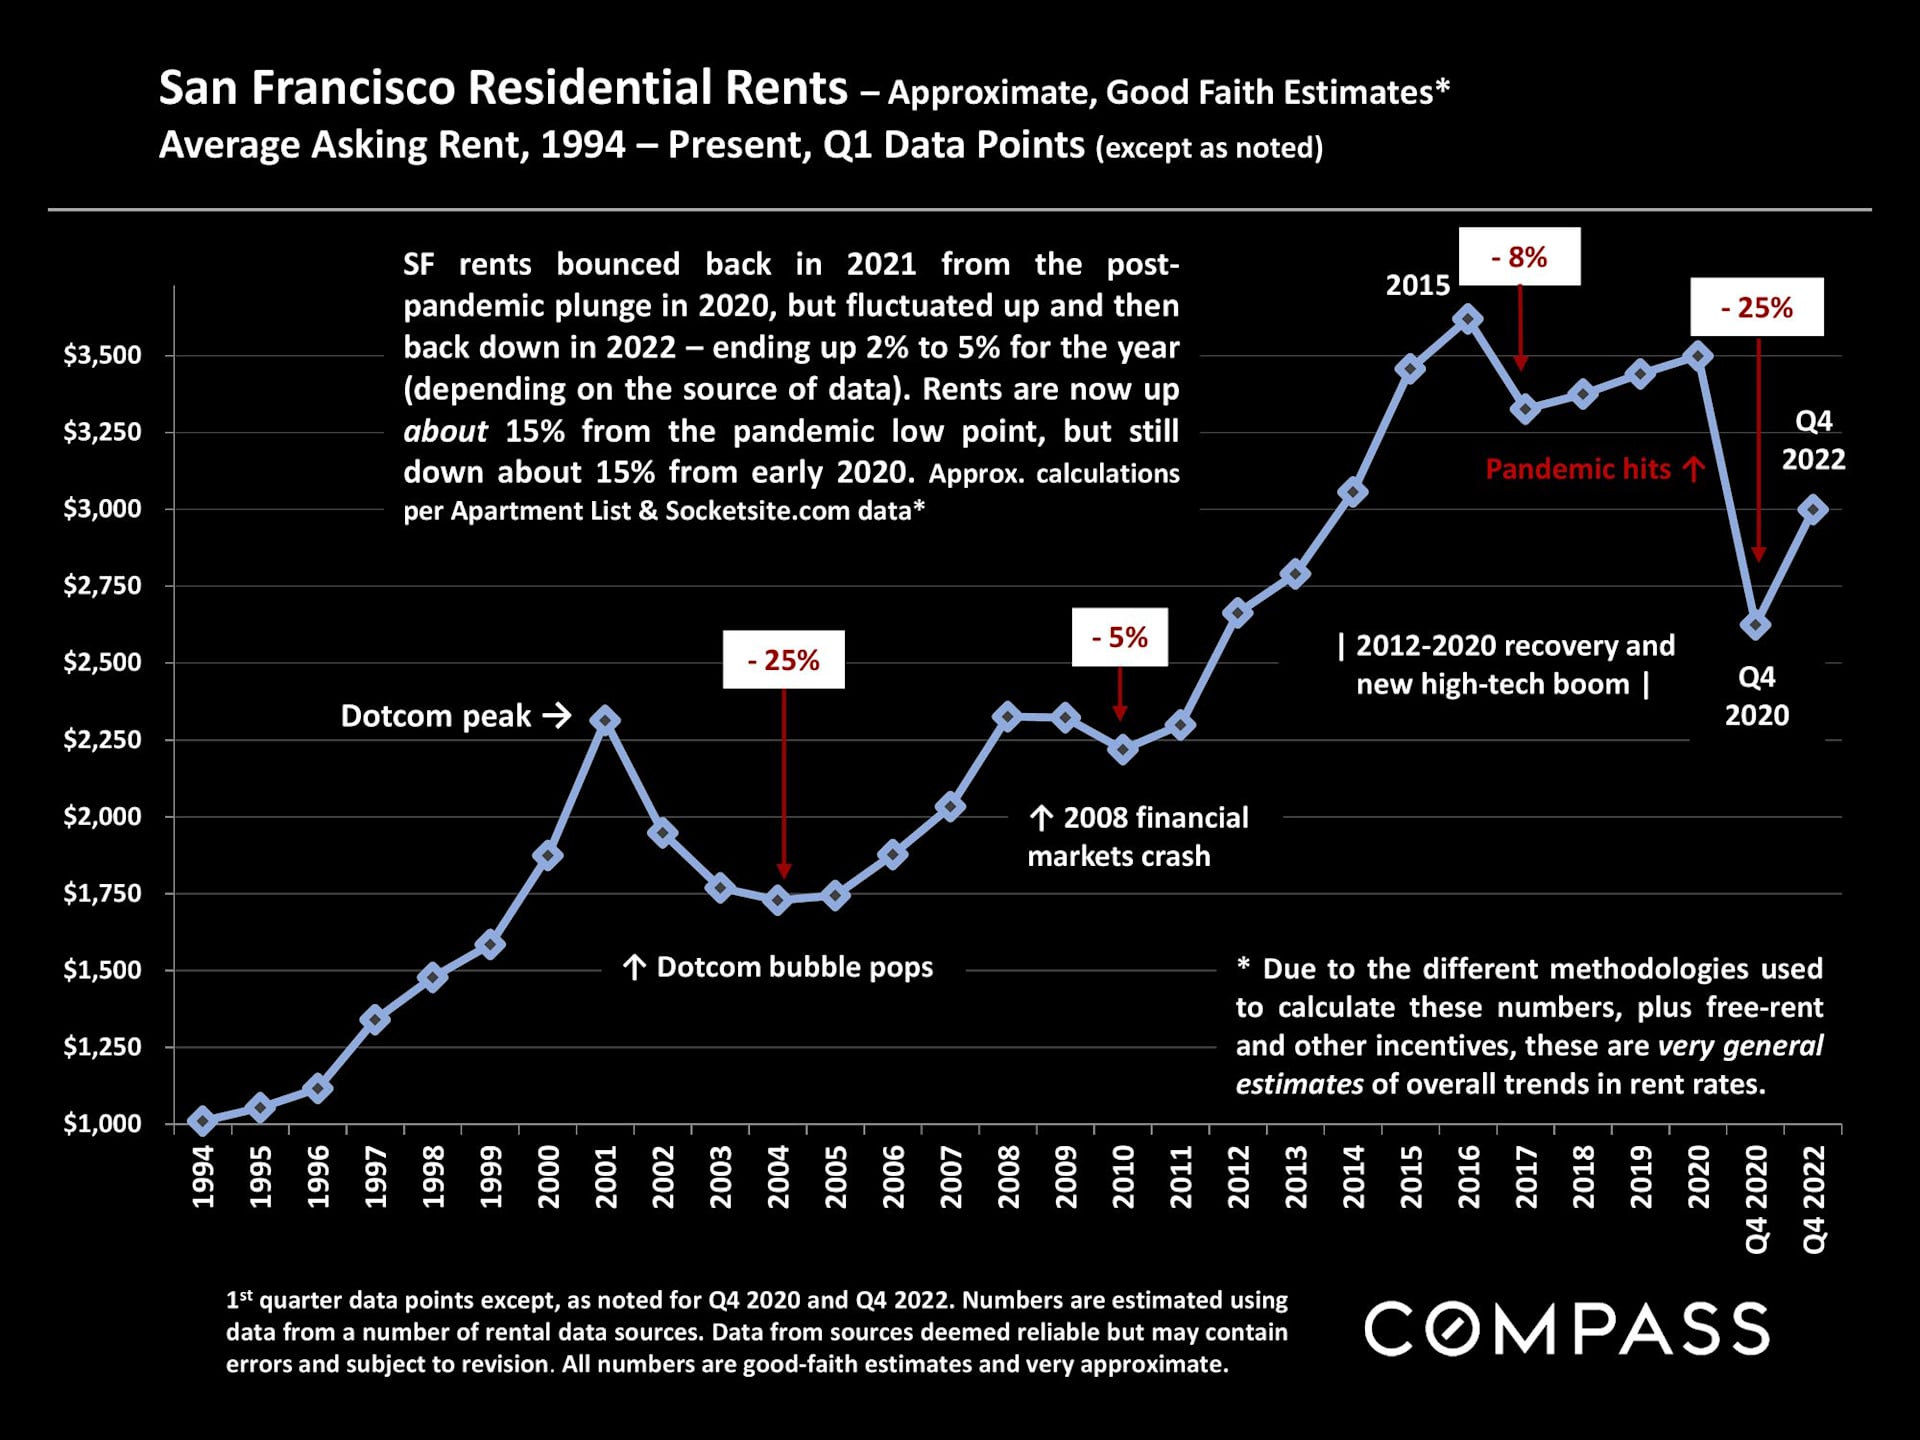
Chart of San Francisco asking rents from 1994 to 2022, showing a sharp pandemic-era drop and partial recovery.

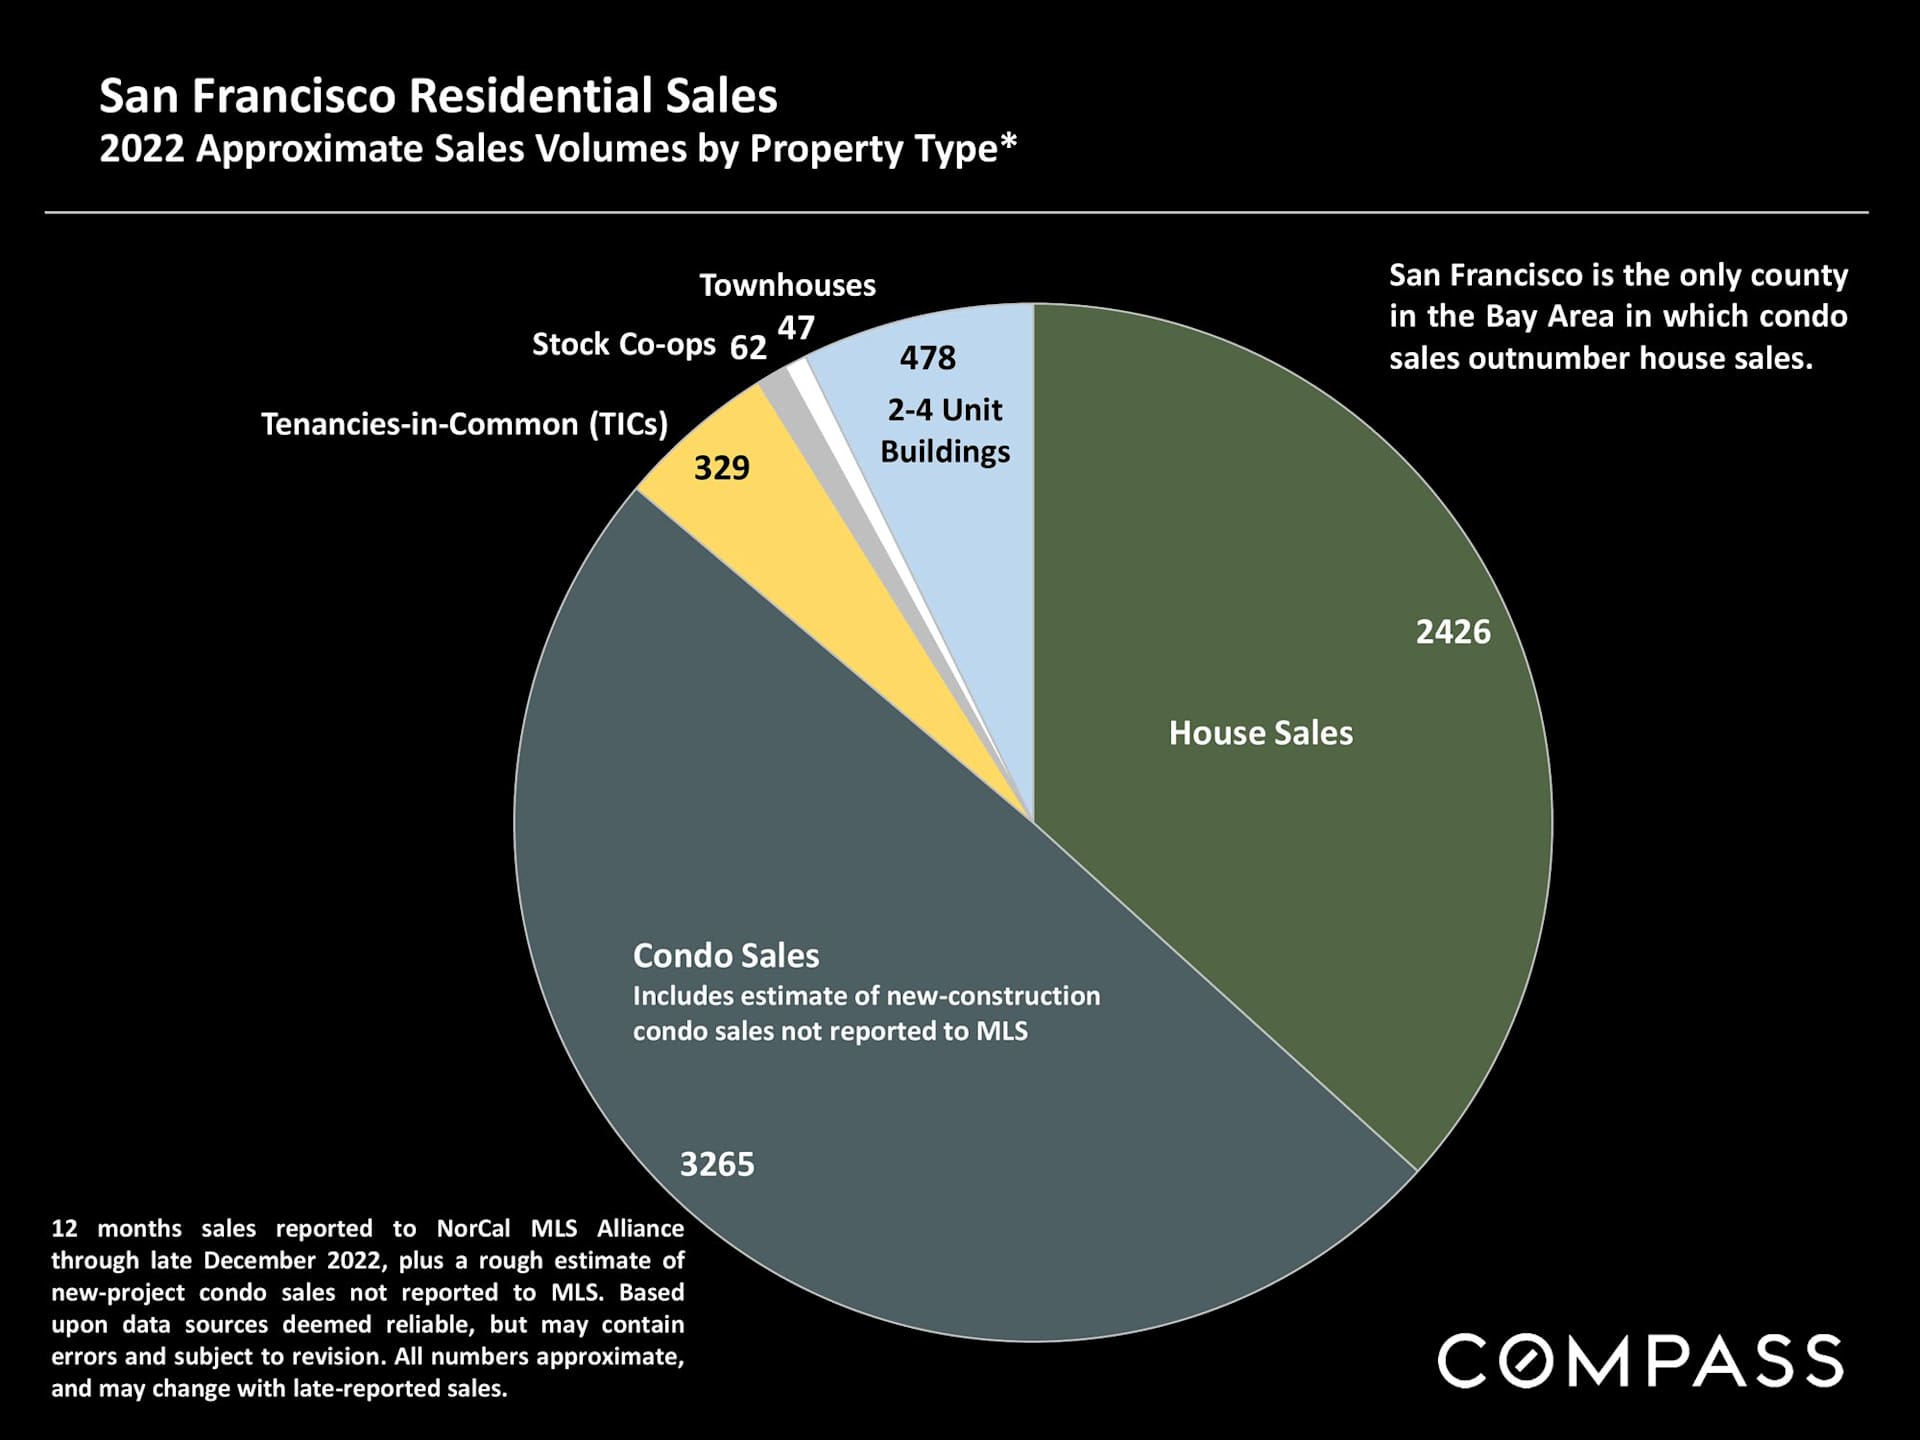
Pie chart of 2022 San Francisco residential sales by property type, with condo sales exceeding house sales.

San Francisco Bay Area home price appreciation report cover with a collage of city, bridge, vineyard, and hill views.

Real estate market report notes on statistics, home values, and Compass disclaimers.

Follow Me On Instagram